Wednesday, November 21, 2012

SSM update: 15.86% of the US lives in states where SSM is legal

Thanks to the 2012 election, three states voted to allow Same-Sex Marriage (SSM): Maine (reversing a 2009 referendum), Maryland, and Washington. This brings the total to 9 states and the District of Columbia (DC) that allow SSM. The total population of people living in this area (using numbers from the 2010 census) is 48,955,409, which amounts to 15.86% of the national population now living in states where equality stretches to same-sex couples in terms of legal rights and protections of marriage. (Yeah... I'm not talking about what religions choose to do with prosecuting their beliefs upon the adherents to their faiths.)

What's interesting is that Minnesota voted down an amendment to deny SSM. There is also increasing discussion about allowing SSM there, as well as in California, Illinois, and New Jersey. If these four states were to all end up allowing SSM, then the number of people living in such states would more than double, rising to 113,135,816, or 36.64% of the population.

More interesting still is that the states of Nevada, Oregon, and Wisconsin are eying the allowance for "civil unions" for same-sex couples. If we count these states' populations into the total of places where - for purely governmental purposes of guaranteeing and protecting rights and benefits - same-sex couples would have the rights as heterosexual couples, this would represent 125,354,427 people or 40.60% of the population.

These projections of potential allowances for SSM and civil unions are not my own conjectures - they're from the Economist:


This could mean that - by the next presidential election in 2016 - just slightly more than 40% of the US population could be living in a state where state-sanctioned and state-participatory discrimination against same-sex individuals' right to have a state-recognized, state-protected, and state-guaranteed marriage (or civil union). But a recent poll in Michigan is something that is raising the possibility that it could well be more than 40.60%:
A recent survey found that 56 percent of the state's residents support gay marriage while 39 percent oppose it. Two years ago, 48 percent supported gay marriage and 51 percent were opposed.
The walls seem to be tumbling down ... at least away from the Deep South. And if Michigan's shift on this position - along with the shifts seen in Minnesota, Wisconsin, Illinois, Oregon, California, and Maine - is anything to go by, it's likely that the shifting position on gay marriage rights is shifting in the same direction in other states that share some of Michigan's demographic and political leanings: Ohio and Pennsylvania.

If (and that's a big "if") both Ohio and Pennsylvania were to vote to allow SSM or civil unions by 2016, then that could bring the total population living in such states to 159,476,950, or 51.65% of the nation's population (and - of course - if other states vote the same way, then that number can only climb).

Still, let's not assume that all our eggs will hatch, or that all the chicks even grow into chickens. Let's sit down and actually be really friggin' happy that we now have 15.86% of the population living in a state where SSM-rights have been granted. Let's be even more happy that the public tide has turned to much that public referenda are now granting these rights.

As people come to recognize that same-sex couples aren't the monsters that paranoid traditionalists want to make them out to be, there will be more positive shifts in opinion. As people come to recognize that same-sex individuals are among their friends, their colleagues, and their families, there will be more positive shifts in opinion. As people come to recognize that same-sex marriage does not destroy heterosexual marriages, there will be more positive shifts in opinion.As people come to recognize that same-sex partnerships are often about love, commitment, and raising families in a safe and caring environment, there will be more positive shifts in opinion. And, as people come to recognize that the growing number of states that allow same-sex marriages and unions are not turning into burning pits of Hell, that pedophilia is not going rampant, or that divorce rates of heterosexual couples is not increasing, there will be more positive shifts in opinion.

Thursday, November 15, 2012

More on identity politics and the politics of identity

Yesterday, I posted a video about why Asian Americans didn't vote for Romney. Today, here's a post by Razib Khan about an additional reason (made a little hotly): religion. I don't always agree with the positions that Khan makes, but this is an interesting piece, even if I think that he makes the connections between religion and voting options a little stronger than I'd think:
I was at ASHG this week, so I’ve followed reactions to the election passively. But one thing I’ve seen is repeated commentary on the fact that Asian Americans have swung toward the Democrats over the past generation. The thing that pisses me off is that there is a very obvious low-hanging fruit sort of explanation out there, and I’m frankly sick and tired of reading people ramble on without any awareness of this reality. We spent the past few months talking about the power of polls, and quant data vs. qual (bullshit) analysis, with some of my readers going into full on let’s-see-if-Razib-is-moron-enough-to-swallow-this-crap mode.

In short, it’s religion. Barry Kosmin has documented that between 1990 and 2010 Asian Americans have become far less Christian, on average. Meanwhile, the Republican party has become far more Christian in terms of its identity. Do you really require more than two sentences to infer from this what the outcome will be in terms of how Asian Americans will vote?

Over half of Asian Americans are non-Christian. The track record of non-Christians voting for Republicans in today’s America is not good. In contrast, Asian American lean toward Republicans is fine, assuming that they are Christian (the Evangelical group above excludes historically black churches). Asian American Catholics are somewhat more Democrat than white non-Hispanic Catholics, but far less than Hispanic Catholics. But the issue is that Christians, aggregating the Evangelical, Mainline, and Catholic categories together, only make up ~40 percent of the Asian American population. In 1990 60 percent of Asian Americans were Christian. Today 30 percent follow non-Christian religions. In 1990 15 percent did.

Read the rest (and check out the data) over at Gene Expression.

Wednesday, November 07, 2012

Presidential firsts (yes, there are more!)

In 2008, Barack Obama was the first not-White man to win the Presidency. This was obvious, and it was a point made by many people.

Another thing was that Obama/Biden was the first Democratic ticket to win an election without having any Southerner (and - by "Southerner" I am not including someone from Delaware or Maryland, which may be historically "Southern", but I'm referring to the "Solid South") on the ticket since FDR/Wallace in 1940!

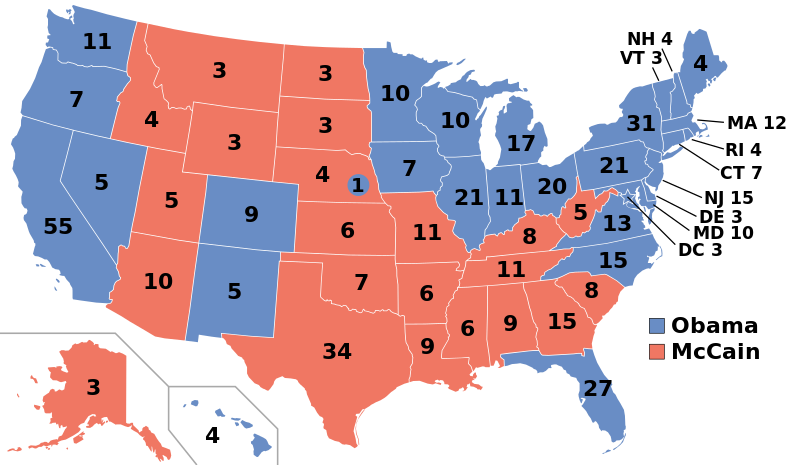
Of course, his ticket (Obama/Biden) was the first Democratic ticket to win the presidency WITHOUT having to win any Southern state. True, Obama/Biden won North Carolina, Virginia, and Florida, but he didn't need those electoral college votes in order to win:

In 2008, Obama won 365 E.V. If he didn't have NC (15 E.V.), VA (13 E.V.), or FL (27 E.V.), he would have had 310 E.V., 38 electoral votes MORE than necessary to win.


These were Presidential "firsts" from 2008. In 2012, there are three additional firsts (although they are all "firsts" due to re-election):

The obvious thing is - like the beginning - that Obama is the first not-White man to win re-election as President. This is also an obvious point made by many people.

With regard to not having Southerners on the re-elected ticket, Obama/Biden is THE FIRST Democratic ticket to win re-election without having a Southerner on the ticket since Wilson/Marshall's re-election in 1916.

In 2012, (as of this writing) Obama won 303 E.V., while also carrying VA. (FL's 29 E.V. haven't been allocated yet.) This means that Obama would have won (with 290 electoral votes) EVEN IF Virginia didn't vote for him.


Is this the end - for now - of the importance of the South in presidential politics? After all, Obama is a not-White man, Obama/Biden aren't from the South, and Obama/Biden and could have won the presidency BOTH times without even winning any of the Solid South states.

... does this spell the end for the Southern Strategy? I already described why looking at "White Southern men" is not an electorally important distinction, since Obama wouldn't need them to win (and he didn't; he lost the overall male vote, and probably REALLY lost the White Southern male vote). Part of this is due to the demographics of the nation (let alone in the South). If the GOP doesn't change their party politics, they're not going to be a viable party in 12 years' time; the demographics - a fundamental of a country that uses democratic measures to make political choices - are just not with their current preferences.

Monday, November 05, 2012

Happy November: Got one chapter done. Working on another

In order to complete my dissertation, I must complete three research chapters and tie them all together into a nice product by adding introduction and conclusion chapters. Smart person as I am, I decided to research three somewhat-interconnected (but not really overlapping at all in terms of methodology, scope, or data set) things. This has meant overall slow progress (and a tendency to procrastinate through blog writing).

However: as of last Thursday, I submitted my first research chapter to my adviser for review, and I'm aiming to have another chapter written by the end of the month. We'll see if that works.

Fingers crossed!