Showing posts with label climate. Show all posts

Thursday, September 07, 2017

Hurricane Irma, warm oceans, and expanding the Saffir-Simpson Hurricane Scale

Back in 2011, I wrote about the current five-category hurricane system that the US uses (known as the Saffir-Simpson Hurricane Scale), noting that the foundational logic of the scale was based on structural engineering questions:
a former NOAA hurricane center administrator and co-inventor of the SSHS that, "there is no reason for a Category 6 on the Saffir-Simpson Scale because it is designed to measure the potential damage of a hurricane to manmade structures. If the wind speed of the hurricane is above 155 mph (249 km/h), then the damage to a building will be 'serious no matter how well it's engineered'."
The current scale tops out at a "Category 5," which is any sustained wind speed above 155 mph. However, if one uses the threshold values for Categories 1 through 5 to develop a regression equation, it is possible to extend this relationship ever outward. Specifically, a revised category scale would be something like this:
Category 1: <95mph
Category 2: 96-110mph
Category 3: 111-130mph
Category 4: 131-150mph
Category 5: 151-175mph
Category 6: 176-205mph
Category 7: 206-235mph
Back in 2011, Hurricane Camille had sustained wind speeds of 175 mph, which is what prompted me to write that post. Currently, Hurricane Irma is reported as having sustained wind speeds of 185 mph, making it the strongest Atlantic hurricane in recorded history. However, based on the current hurricane scale, both Camille and Irma are classified as Category 5, even though Irma is obviously far stronger than Camille (which was - itself - a massive hurricane).

Indeed, the current system is fundamentally limited and fundamentally limiting, since one loses any sense of comparative scale once you enter "Category 5." And what would it hurt to look at adding a "Category 6," especially if warming waters are known to lead to stronger and more sustained hurricanes? Indeed, with warming oceans, hurricanes that will reach sustained wind speeds between 175 and 205 mph will not be theoretical. Indeed, Hurricane Irma is proof-positive that such hurricanes can and will form.

But so what? Why would that matter?

Well, in the US, the SSHS is a widely known and used shorthand for hurricane strength. It's something that people latch on to when discussing preparedness measures and when making comparisons against past events. But if the maximum scale is effectively open-ended, the designation "Category 5" will be shared by a hurricane with wind speeds of 155 mph and another with winds speeds of 185 mph (like Hurricane Irma). And the simple fact is that wind speeds of 185 mph are fundamentally different than wind speeds of 155 mph, and placing both in the same open-ended category will not help with making short-hand comparisons that would be equivalent to comparing a Category 4 hurricane against a Category 3 hurricane.

The way we categorize natural phenomena is important, since it structures the way that we view and respond to the world, and if we continue to use a hurricane classification system whose comparative utility declines into a future that is expected to have stronger hurricanes, that can impact the type of public response given to future storms.

Monday, September 21, 2015

AZ congressman thinks he's a better Catholic than the Pope (and a better climate scientist than all climate scientists)

Apparently, the Pope isn't Catholic or Christian enough for AZ Congressman Paul Gosar, who wrote an open letter to TownHall.com. In it, he tells why he is "boycotting" the papal address to the US Congress. And in it, he also shows himself to be incapable of making a logical argument. (Either that or I can't follow his logic.) So here's his letter (along with my comments).

(tl;dr version: Gosar is a nitwit who is pandering for votes from constituents who also don't believe in climate change.)
It is difficult to convey the excitement I first felt when it was revealed that His Holiness Pope Francis was invited to Washington D.C. to address the world from the floor of the House of Representatives. (Great! So you'll go and pay attention to the man who is the head of your Church?) Many believed, like I did, that this was an opportunity for the Pope to be one of the world’s great religious advocates and address the current intolerance of religious freedom. (Aaaand here you prove to be an idiot. The purpose of the Pope's visit was announced beforehand, and it shouldn't come as a surprise to you that it's about his last Encyclical, Laudato Si'.) An opportunity to urgently challenge governments to properly address the persecution and execution of Christians and religious minorities; to address the heinous and senseless murders committed by ISIS and other terrorist organizations. (Again, this is not why he is travelling around the world. He is travelling around the world in order to talk about the implication of his Encyclical.) An opportunity to address the enslavement, belittlement, rape and desecration of Christian women and children; to address the condoned, subsidized, intentionally planned genocide of unborn children by Planned Parenthood and society; (You are intentionally being an idiot; the Pope is traveling around the world telling people about the Christian and Catholic message of the Encyclical. He is doing other things, too, but his main point is about the Encyclical. And as a Catholic, you should know how big of a friggin' deal a Papal Encyclical is, and - relatedly - why he would want to talk about it on his state visits.) and finally, an opportunity for His Holiness to refocus our priorities on right from wrong. (This is the first point that is about how the Pope is framing his Encyclical: refocusing our priorities on right from wrong. Too bad it is clear even now that you don't think that the Encyclical does this, or that the point of the Encyclical is contained in the list of moral issues that you feel the Catholic Church and the US government are failing the American people on.)

Media reports indicate His Holiness instead intends to focus the brunt of his speech on climate change--(Duh. His Encyclical is about climate change. Seriously, have you read the Encyclical put out by the head of your Church? You claim to be a good Catholic, but I think you haven't taken the time to actually read the Encyclical. And with you choosing not to be in DC to hear what the Pope has to say about it, you are choosing to remain ignorant. "Well done.") a climate that has been changing since first created in Genesis. (Yeah... The Encyclical talks about this and why this framing of it is not useful.) More troubling is the fact that this climate change talk has adopted all of the socialist talking points, wrapped false science and ideology into “climate justice” and is being presented to guilt people into leftist policies. (I'm sorry, but I've read through the Encyclical, and I saw all the references to Biblical morality and moral messages from various Christian saints... all of whom died centuries - if not a millennium before the the idea of "leftist policies" was even imagined as a thing. However, if you were to reframe the writings of the saints and the apostles in a modern political framework, then Jesus, the apostles, and the saints all tend to be talking about "leftist policies." In that light, then, the teaching of Christianity are what you should be blaming, not the Pope, but that would cause really obvious logical problems to your argument from your Christian faith...) If the Pope stuck to standard Christian theology, I would be the first in line. (He is. He cites previous pontiffs, saints, apostles, and Jesus Christ. If these people aren't part of "standard Christian theology" then who are?) If the Pope spoke out with moral authority against violent Islam, I would be there cheering him on. (Christianity was around centuries before the rise of Islam. There is nothing in the Bible talking about Islam. As such, Islam - specifically - isn't a part of "standard Christian theology," which is what you bemoaned the Pope not talking about in your previous sentence. And here you are also bemoaning the Pope for not talking about non-standard Christian theology and political policies. Dude, pick a logical argument and stick to it!) If the Pope urged the Western nations to rescue persecuted Christians in the Middle East, I would back him wholeheartedly. (This is *also* not part of "standard Christian theology." It is a part of public policy, which you seem to be against the Pope talking about when it lines up with "leftist" policies that are based ont he Bible, but when it's about non-"leftist" policies that have no Biblical connection, you wish the Pope would talk about them... as the major part of his visit to talk about his Encyclical? Seriously, you are packing a bunch of pride in there!) But when the Pope chooses to act and talk like a leftist politician, then he can expect to be treated like one. (And when the Pope chooses to act like the head of the Catholic Church, you will choose to act like a member of the Catholic Church? You feel like you had a wrong committed against you, but you choose not to turn the other cheek? How un-Christian of you.) Artist and columnist Maureen Mullarkey (who isn't the Pope) effectively communicated this fallacy stating, “When papal preferences, masked in a Christian idiom, align themselves with ideological agendas (e.g. radical environmentalism) [they] impinge on democratic freedoms and the sanctity of the individual.” (But when papal preferences, maked in a Christian idiom, align themselves with idological agendas (e.g., expanding war in the Middle East), they don't impinge on democratic freedoms and the sanctity of the individual?" How friggin' logically inconsistent!)

The earth’s climate has been changing since God created it, with or without man. (Seriously, this is a tired old rag that shows next to no understanding of what climate science is, let alone what science is. It also shows that you have no interest in actually reading or understanding the Encyclical.) On that, we should all agree. (No, because it's a loaded premise.) In Pope Francis’ encyclical on the environment (written with the consultation of that great seminary the EPA and its embattled (only because of knuckleheads like you) head Gina McCarthy), he condemned anyone skeptical of the link between human activity and climate change (because there are almost no rational, science based arguments against it, and even those that are based in the scientific method are highly problematic.)  and adopted the false science (calling climate science "false science" without appearing to know any science is another example of poor thinking) being propagated by the Left (and the right and the center; not everyone conforms to your view of the world and what to do about it). If the Pope wants to devote his life to fighting climate change then he can do so in his personal time. (He is doing exactly that, silly. He is speaking to the US Congress on his personal time, too! Seriously, this is such a strange and non sequitur statement that I don't know what to do with it.) But to promote questionable science as Catholic dogma is ridiculous. (And now you have a problem with your statement of being a "proud Catholic," since a "proud Catholic" who fundamentally disagrees with a papal encyclical is showing themselves to be far more proud than Catholic.)

Furthermore, I am a proud Catholic. (Who just chooses - based on inconsistent logic that isn't based in any apparent relevant science - to oppose the leader of his Church.) I chose to attend a Jesuit college in the Midwest, not just for my undergraduate but also my graduate studies (D.D.S.). I received an excellent education where I was taught to think critically (If this letter is an example of how you were "taught to think critically" then you got a poor education in this area.), to welcome debate and discussion (And by "welcome debate" you apparently mean "write an open letter to a right-wing online news site about how you don't agree with the Pope, the science of climate change, and the impacts of climate change on the world's poor, and that you would rather completely not engage in any chance of debate or discussion on this topic, but instead will choose to hightail it back to Arizona and pout about how bad the Pope is.) and to be held accountable for my actions (By making public policy decisions that aren't scientifically valid?); a trademark of a Jesuit education. (Yes, these are trademarks of a Jesuit education... all of which apparently never actually became internalized.) And finally, I am a Conservative, a member of Congress, a constitutionalist and adamant defender of our Republic; an American that believes in strict adherence to the rule of law and a firm believer in our First Amendment protections, in this particular discussion, the freedom of religion. (This statement fails utterly in even bringing up the philosophical point that it is not possible to be a proud Catholic - or member of any religion - and also a staunch American - or citizen of any nation. Another lack of distinction for the AZ Rep.)

So at this pivotal moment in world history, His Holiness, Pope Francis, is intending to spend the majority of his time on one of the world’s greatest stages focusing on climate change. (Again, yes. Again, it's because that is what his Encyclical is about. And again, if you had read the Encyclical, you will see why he believes that it is actually an important point to bring up on "the world's greatest stages.") I have both a moral obligation and leadership responsibility to call out leaders, regardless of their titles, who ignore Christian persecution and fail to embrace opportunities to advocate for religious freedom and the sanctity of human life. (He is not ignoring Christian persecution. He is just not talking about it as the primary purpose of his visit to the US. It is possible to hold positions on a topic without speaking about that topic all the time. You do know that, yes?) If the Pope plans to spend the majority of his time advocating for flawed climate change policies, then I will not attend. (Because you are open to "debate and discussion"? Oh, wait, it's because you aren't, and it's because you need to do something to transform your tantrum into vote-pandering.) It is my hope that Pope Francis realizes his time is better spent focusing on matters like religious tolerance and the sanctity of all life. (I'm sure that he does have opinions about these matters. In fact, he's talked about them.) As the leader of the Catholic Church, and as a powerful voice for peace throughout the world, His Holiness has a real opportunity to change the climate of slaughter in the Middle East (Which means encouraging more warfare in the Middle East against violent Islam?)… not the fool’s errand of climate change. (Again, it's clear that you haven't read any of the Encyclical, let alone any of the science about climate change and the impacts of climate change. Or the reports from the UN, Oxfam, and Save the Children. Or military and CIA reports about the security implications of climate change. But what do they know? Those organizations are all just on a fool's errand, right?)

Monday, August 03, 2015

Super-typhoon Soudelor and a need for new hurricane & typhoon metrics

Super typhoon Soudelor is hitting sustained wind speeds of up to 178 miles per hour! That totally blows the Beaufort scale out of the water, and also leaves the Saffir-Simpson scale well behind, too.

There are two reasons why these scales are not too useful:
  1. They all have maximum values,
  2. The maximum values are tied with technologically based assumptions and purposes.
The Beaufort scale maxes out at "Hurricane force" winds that are anything of 72.9 mph or greater, and this maximum was set based on the technological limitations of shipping, for which the scale was developed. The idea was that anything greater than a category 12 was effectively as dangerous to ships as the winds at 72.9 mph, and so there was no reason for ship captains to worry about categories larger than 12.

The Saffir-Simpson scale maxes out at "Category 5 hurricane" winds that are anything of 157 mph or greater, and this maximum was set based on the technological limitations of building construction in the 1950s US. The idea was that anything greater than a Category 5 was effectively going to blow apart any building, and so there was no reason for having higher categories (despite an increasing number of buildings with the capacity to withstand 157mph and higher winds).

It's that "or greater" part that really is troubling to me. Why? Because it means that a hurricane with sustained winds of 157 mph is classified as a "Category 5" hurricane... right along with a super typhoon like Soudelor, which is reaching wind speeds of almost 180 mph.

Back in 2011, I noted that the scale for the Saffir-Simpson scale was somewhat linear, up to Category 5; but if we took that linear scale and extended it, we would be able to include a Category 6 (and even Category 7) type of storm:

Category 1: <95mph
Category 2: 96-110mph
Category 3: 111-130mph
Category 4: 131-150mph
Category 5: 151-175mph
Category 6: 176-205mph
Category 7: 206-235mph

Under this extended classification, Super typhoon Soudelor is a Category 6; one of only a few in recorded history, but potentially one of a growing number in a future with global warming.

Similarly, the Beaufort scale can be extended beyond the category 12. The Beaufort Scale progresses along an x-squared rate (Excel comes up with the equation: y = 0.4952x^2 + 5.2857x + 0.0382), giving us:

Beaufort Number
0: <7mph
1: 0.8-3.4mph
2: 3.5-7.4mph
3: 7.5-12.2mph
4: 12.3-17.8mph
5: 17.9-24.1mph
6: 24.2-31.0mph
7: 31.1-38.4mph
8: 38.5-46.4mph
9: 46.5-54.7mph
10: 54.8-63.6mph

11: 63.7-72.9mph
12: 73.0-83.7mph
13: 83.8-94.7mph
14: 94.8-106.3mph
15: 106.4-118.5mph
16: 118.6-131.3mph
17: 131.4-144.8mph
18: 144.9-158.8mph
19: 158.9-173.5mph
20: 173.6-188.8mph

Under this classification, Super typhoon Soudelor has a Beaufort number of 20! This is very different from just classifying it as a 12, solely because 12 arbitrarily is the largest value on the Beaufort scale.


Why worry?
Back in 2011, I wrote up a short extension of a 2005 paper in Nature, that indicated that the total number of hurricanes has been remaining the same, but that the strength of the hurricanes has been growing stronger. This means that there are a lower number of Category 1, 2, and 3 hurricanes now than in the past, but the number of Category 4 and 5 hurricanes has increased:


What is being measured here is storm intensity by proxy of hurricane Category. However, such a measure will not show the entire picture if Category 5 remains anything over 157mph, since this open-ended category definition would mask the rising intensity of hurricanes that is shown in the graph.

While this might seem an academic point, another way to think about this is to ask why the Richter scale doesn't have a maximum value? After all, if the Saffir-Simpson scale was built around the idea that structures wouldn't be able to sustain a force of a Category 5 hurricane, then why shouldn't the Richter scale max out at 7.0? And if the idea that the Richter scale should max out at an arbitrary number (like 7.0) sounds ludicrous, then why accept the idea that Category 5 in Saffir-Simpson (and Category 12 in Beaufort) are the maximum of the scale?

Especially in a future where the numbers of increasingly intensive hurricanes is only going to increase as the numbers of "lesser" hurricanes decrease?

Thursday, April 09, 2015

On sectorial water use and obfuscation via statistics

So a friend of mine posted this picture on their Facebook wall, and its message seemed well-intentioned but also so very problematic.

Let me first state that I do think that California must make hard decisions about water restrictions and water use, and I don't think that the current forms of water restrictions and bans are anywhere approaching what would be an equitable diminution in water use (and never mind the problems that California's system of water laws, interstate compacts, and inter-watershed irrigation systems play in creating further problems in the legal, political, and water management worlds). However, I don't know whether this image presents a useful comparison on all fronts. Furthermore, the presentation is arguably deceptive, since the compared units are not the same, with toilets (presumably being the one thing that the viewer is supposed to be sympathetic toward, since it is placed last) being based on a very low metric of gallons/flush of one toilet, and all the rest (presumably the ones the viewer is supposed to feel antagonistically toward, since they are often held up as being "enemies" of water use) being based on really large sector-wide annual figures.

This simplistic switch of metrics undermines the presumed argument of the image on two fronts. First is the casual deception: why present sector-wide annual figures for the "bad" water uses, and personal, single-use figures for the "good" water use? This presentation does not present an easy-to-grasp comparison between water uses at the State level. (There is also the problem of using words like "million" and "trillion" to describe the amount of water used, since it is so easy for people to lose the differential scales between hundred, thousand, million, billion, and trillion, but those sorts of distinctions are better covered in places such as this visualization of what $1 trillion looks like.) In order to place the water used in Californian toilets in direct comparison with the others, we must first convert the value of 1.6 gallons/flush into a figure of gallons/year throughout California. When we do this, we find that toilet-flush water use in California is at least:

1.6 gallons/flush (x 5 flushes/person/day)
= 8 gallons/person/day (x 38,800,000 Californians)
= 310,400,000 gallons/day in California (x 365 days/year)
= 113,296,000,000 gallons/year

(I write "at least" 113,296,000,000 gallons/year, since I am using the figures for household toilets and only 5 flushes/day, even though the average is somewhat higher. This number doesn't include, of course, water use statistics for public toilets, urinals, port-a-jons, etc.)

Now let's list all the water uses presented in the picture in increasing gallons/year:

70,000,000 gallons/year (fracking)
400,000,000 gallons/year (Nestlé bottled water)
113,296,000,000 gallons/year (toilet flushes)
1,100,000,000,000 gallons/year (almond farms)

When we look at toilet flushes in this perspective, it is clear that it is 1,618 times greater than the reported value for fracking. Furthermore, it is 283 times greater than the reported value for Nestlé bottled water. Indeed, when presented in this way, California toilet-water use can be presented as being far more profligate than either fracking or Nestlé bottled water, and by a LONG shot, simply because California has SO many people, and almost 60% of that population (22,680,000 in 2010) lives in sunny, drought-ridden SoCal. This places domestic water use (which includes baths/showers, toilets, dishwashing, lawn irrigation, carwashing, etc) far ahead of most industrial water uses... save agriculture

Indeed, when compared to the reported value of almond farms, toilet-water use is a mere 10%. However, there's a problem with the number presented in the graphic for almond farms. Specifically, the number of 1.1 trillion gallons/year is 1.6 times greater than the value reported by Hanson out of UCDavis, whose figure of roughly 2.1 milion AF/year works out to roughly 680 billion gallons/year (compared to this number, toilet flush water use is roughly 16%).

Let's look, though, at water used to grow alfalfa, which is, according to Hanson, the largest agricultural water use in the State. Accordling to Hanson, alfalfa grown in California uses roughly 5.2 million AF/year, or roughly 1.7 trillion gallons/year (which is about 2.5 times greater than the amount he reports for almond and pistachio irrigation). The second-largest agricultural water use (reported by Hansen) is for forages, which uses roughly 3.3 million AF/year, or roughly 1.1 trillion gallons/year.

So we can see that -- from an argument based around comparative water uses alone -- the merits of placing fracking and Nestlé bottled water fall flat, since toilet-flush water use far outstrips both of these two uses combined. It would have been a better argument to put up alfalfa farms and forage farms. However, it's almond growers that have been in the news, and not alfalfa or forage, which is likely why it is almond growers that are shown (even though they are not the largest agricultural water users, and even though they have a far more valuable crop than either alfalfa or forage crop farms).

Now, one could still use the water use figures presented in the graphic to make associated arguments, but I was unable to find a single argument that held true against the fracking, Nestlé, and almond farms while preserving toilet flushing. For example, one argument for water conservation that is often made against fracking regards removing water from the hydrological cycle completely, and it's true that one could make the argument that water used in fracking is effectively "lost" to the immediate hydrological cycle (since fracking wastewater is often deepwell injected) and therefore cannot be used for drinking or any other use, but that argument doesn't hold for almond farming or bottled water, since both return their water to the immediate hydrological cycle (primarily as groundwater recharge, evapotranspiration, and biomass decay in the case of almond farms and as urine that is flushed down a toilet in the case of bottled water). So the argument that it's about removing water from the hydrological cycle use is not valid across cases.

Another common argument against fracking, irrigation, and bottled water is that these uses are consumptive uses. In the case of fracking, this is undoubtedly true (as laid out above), and water used in agriculture is often also considered to be consumptive. However, the charge of consumptive use can also leveled at most of California's toilet water flushes, since much of the State's water is pumped from watersheds in Northern California and the Colorado River, creating consumptive water use pressures in those areas.

The only real argument that comes to mind is that it is unfair for the government to impose water restrictions upon flesh-and-blood citizens but not impose water restrictions upon corporate "citizens." However, such an argument isn't a water volume argument, but a water rights argument, especially in how Californian water rights are not egalitarian, with a large part of this argument lying in the problems associated with California's water rights laws. Most individual Californian citizens do not own any water rights, let alone water rights that predate 1914. The date of 1914 forms the demarcation date between so-called "junior" and "senior" water rights, and those holding junior water rights will have their rights to water curtailed before those of senior water rights holders. Such a system of rights is based on a "first in place, first in right" principle, with a strong incentive for the right to be held by a non-human entity (such as a corporation, water district, or the like), since the death of an individual could lead to the "death" of that right. From an equity perspective, such distributions of water rights is inherently inequitable, since it creates structural inequalities that become evermore entrenched as the value of water increases (making the purchase or transfer of water rights less likely to occur). During times when water availability is high, such a structurally unequal distribution of water rarely impacts large swathes of citizens. In cases of drought, though, such inequalities emerge. But regardless of the structural inequalities that California's water rights system imposes upon its citizens, the percecption of unfairness in who gets the restrictions is not due to water volumes (as the graphic implies), but due to water policy and water law.

One "good" note though (if only from a perspective of masochistic schadenfreude), is that if the drought continues, it is likely that even those holding senior rights (which includes many major agricultural water users) will have their water withdrawals restricted.

In sum, while bottled water and fracking are often seen as problematic for various social, public health, and environmental reasons, the comparative water consumption in these two sectors doesn't hold a candle to the total sector-wide water consumption of toilets. Furthermore, hiding the scales of water use between different water uses in the way presented in the graphic is deceptive, and such deception can foster mistrust of the messenger or supporter of the message. In other words, in order to make the graphic less deceptive and more salient to a message associated with different types of water use, it needs more than just a simple comparison of water volumes.

Of course, this additional nuance can create problems when trying to disseminate a message...

Thursday, August 14, 2014

When People Do and Don't Listen to Scientists

I saw the following on a friend's Facebook wall:


This reminded me of a talk that was given by Dan Gilbert back in 2007. As I summarized when I wrote about this, this is because:
Four features global warming lacks:

A face: understanding what other people are doing is so crucial that our brain has developed an obsession about human agency. This is why we see faces in the clouds, but not clouds in peoples' faces. Global warming is not trying to kill us, and that's a shame.
A violation of moral suasion: Visceral emotions are aroused by things our brains have been concerned: food and sex. NOT atmospheric chemistry. Societies are built around who you can sleep with and what you can eat, and not about how much you can consume.
A threat to the present: The brain is an exquisitely designed "get-out-of-the-way" machine. Only recently has our brain been able to think about the future and take actions againt a future event, which is why we use dental floss and invest in 401k plans. However, global warming is still in the "R&D" version.
Ability to see absolute changes: Because we are so bad at perceiving changes gradually, we are more likely to tolerate it since it was a day-to-day gradual change, not an abrupt one.
 While global warming lacks these things, ebola has all of them.
A face: ebola is carried around by people.
A violation of moral suasion: There are many social hangups about the sick, and some people (and societies) explain one's sickness as an outcome of one's past moral choices.
A threat to the present: Over and over again, one of the most prominent things that is said about ebola in its description is it's high mortality rate: up to 90% mortality. That's a pretty immediate threat to the present.
Ability to see absolute changes: One day a person is well, the next day that person is sick, another day and that person is dead; very, very absolute changes.
 So, yeah, when people are talking about global warming, who cares about what the scientists are saying? (Because global warming doesn't punch the "reactionary buttons" that we have evolved.)

Conversely, when people are talking about ebola, who cares about what the scientists are saying? (Because ebola punches - and punches hard - all of the evolved "reactionary buttons" that we have.)

Here's the video of Dan Gilbert's 2007 talk:

Saturday, June 29, 2013

Misunderstanding Flood Frequency and Climate Change

Apparently, some people still have problems understanding what the difference is between "climate" and "weather" - or in this case the impact of a changing climate on flooding (which is an outcome of severe weather). The high rains that hit the Calgary, Alberta region of Canada were caused by what The Weather Network described as an "atmospheric river"caused by a major meander in the Jet Stream. This sort of major meander in the Jet Stream is what caused Alaska to shatter high-temperature records, and could be linked to what is now causing a massive heat wave in much of the western US. This meandering of the Jet Stream is the reason why the UK is having such a soggy summer. And why, exactly, is the Jet Stream meandering so much? If only we had an explanation for it that makes sense of it in scientific terms. Oh, wait, we do, and it's called climate change (aka global warming).


See? Climate change is causing increased warming in higher latitudes. Warmer air in the higher latitudes means that the energy gradient compared to lower latitudes diminishes, which means that the Jet Stream meanders more. This is what the theory predicts, and this is what we actually see.

But - apparently - many people don't understand this. Many in the initial piece really wanted to bludgeon others with the contention that - since the Bow River had flooded in the past to the same magnitude (and even greater amount) - the current flooding has absolutely nothing to do with climate change. This is problematic on two fronts. The first is that the evidence of why the Bow River flooded (the "atmospheric river" caused by a major meander in the Jet Stream, which is exactly in line with what our models of climate change would predict to become more common). The second is that the justification for the argument (that we can use historic data and historic probabilities of flooding to predict the likelihood of future flooding) fly out the window when we recognize that global warming will alter the underlying processes governing flooding.

There was one particular commentator - Luke - who was more than a bit of an arrogant twit. Unfortunately, it looks like he deleted all of his comments from the page. (I'm making the assumption that he did it himself, because none of the other obviously-wrong-and-just-as-arrogant statements have not been removed.) Still, Luke's comments showed an obvious misunderstanding of flood frequency and the link between floods and global warming (outlined above). The basic contention by Luke was that the recent flooding in Calgary was nothing strange, and that - in fact - the name of the river indicates that flooding is a normal part of the river's course, citing this story, and specifically this passage:
The Bow River gets its name from the Peigan name “Makhabn” which means the “river where the bow reeds grow.” And a good place for reeds to grow is a flood plain.
To Luke, the fact that bow reeds grow on flood plains (and - apparently - that the term "flood plain" has the word "flood" in it) must have meant that the recent massive flooding wasn't really that big of a deal. To that contention, I wrote:
Perhaps you ought to look up what a floodplain is, and what the flooding frequency of a floodplain.

Or you can just keep believing that you aren't seeing the truth of your constructed reality being washed away. But that's your choice.

I prefer to side with reality. Call me biased in that way.
His response was to point me to another comment that he made about the size of the ten biggest floods recorded on the Bow River in Calgary. However, if you knew what a flood plain is, you would know that flood plains are not flooded only when there are historically huge floods. Indeed, flood plains are flooded far more frequently than once every 100 years or so. It's why they're called "flood plains", instead of just "plains." Indeed, I decided to even give Luke a link to an easy-to-read explanation from the USGS (yeah, I know, Calgary is in Canada, and the USGS is a US governmental agency, but the hydrology of rivers doesn't change at the border). (The portion in Courier is a blockquote from his comment, to which I was responding.)
Had you bothered to look at the table I posted below, you'd know exactly what the frequency is. But, evidently, all you've got is a big mouth.
Umm... Actually, all you're doing is showing the extent of your naivete about these issues. What you provided is the historical maximum floods. I actually did see that table. However, these incredibly large floods are not the only ones that inundate floodplains, and pointing to only this table indicates to me that you don't actually know what a flood plain is.

(To recap: Your original contention is that the name of the place - river where the bow reads grow - indicates that this is a flood plain, and that flood plains are known for ... flooding, and so what we just saw in Calgary ain't that big a deal. And then when I asked you if you actually know what the flooding rate of a flood plain is, you pointed me to a table that shows only the largest floods, which - if you know anything about flood plains - doesn't even come close to the numbers of floods that inundate a flood plain, which indicates your ignorace of what a flood plain actually is.)

Here is some reading material about what a flood plain actually is, and what the flooding frequency of a floodplain is. (I'll give you a big hint about where to find the answer: paragraph three, which begins with the words "Bank-full discharge..."

http://nevada.usgs.gov/crfld/floodfreq_desc.htm

Of course, these floods are several magnitudes smaller than the one that hit the city, but the point is that you can have flood plain inundation - and therefore have a great place to grow bow reeds - with river discharge rates far below the one that you're trying to show as being no big deal.

Still, I applaud your efforts to try and understand something that either beyond your comprehension or actually operates in a way that runs counter to your presuppositions. My advice to you is to keep working at it, eventually you might come to recognize that you're wrong, which might then allow you to actually learn something correct.

Good luck!
After this point, Luke decided to cut his losses and say that I won... but without actually recognizing why his position was wrong. I really wish that I had his wording, since it's patently clear that Luke was just trying to find a way to get out of having to argue against someone who slung his arrogance back in his face, along with a ready understanding of the very facts that he was trying to use to bludgeon his opponents. Of course, his weasel-worded "concession" comment tried to have it both ways; saying that I won the debate but that he was right on the facts. However, there was a problem... A: there was no "debate", and B: the whole point of my comments were that he was wrong on the facts. (Did I mention that he was an arrogant-twit?) So, since he crowned me the victor, I felt that it was important to explain to him why his concession was actually just annoying:
Wow. Apparently you don't understand simple hydrology (or you are incapable of taking 10 minutes to read some easy-to-digest science from people who do and written for people who don't).

I'm not going to waste time even trying to explain more to you, since you have twice shown an unwillingness to actually make the slightest modicum of effort to understand why your statements are just grossly and laughably wrong.
To this, he gave the completely bizarre (and equally weasel-worded) response that amounted to, "But I said you won. Why don't you just accept that you won and move on?" And I decided not to respond further, since - as I wrote - he wasn't worth my time.

Things were left there for a day, and now, another commentator felt that I was too harsh on Luke, and insinuated that some of the positions I outlined were wrong:
Your arrogance overshadows everything you've said. The point is that the big floods in Calgary were 125 years ago when 1/100th as many buildings were on the Bow River's flood plains. So this flood was both normal, and predictable. That may not follow the climate alarm industry's script, but it is observed fact. BTW, the Bow River's floodplains mostly grow cottonwoods.
I do recognize that I'm acerbic. And I also recognize when others are being acerbic. If someone wishes to be acerbic, I'm more than happy to oblige them, but what am I supposed to do with this comment? I mean, there is nothing there that actually is written to confront or try to refute any factual piece that I wrote (other than the observation about the current plant ecology, which I didn't introduce in the first place) while simultaneously implying that none of it is valid because I wrote arrogantly to an arrogant person or to bring up points that are only tangentially related to things that I wrote and to point out that the reference to the plant ecology of the Bow River (which I didn't introduce, but was actually responding to) was incorrect. Well, I decided to spend about 30 minutes to write the following exhaustive reply to each of the points that this commentator raised (many of which I didn't discuss at all in the first place, but whatevs):
As with kindness, respect, or sincerity, I return arrogance, like for like, pound for pound, and Luke was dishing his arrogance out like there was no tomorrow. From the above, though, you'll note that neither Luke nor I really minded (or at least commented that we minded) on the heights of arrogance that we were using to talk with each other. I enter each interaction with the understanding of how - based on the evidence - the other person/people are already conducting themselves in the forum, and apply the Golden Rule: they are treating others with arrogance, which means that it is apparently how they wish to be treated. (After all, if they didn't wish to be responded to with arrogance and derision, they shouldn't have done it in the first place, right?) However, those are issues of interactive game theory and socialization, which (although an interesting topic) isn't the one covered by this article, nor by Luke.

To the substantive points you make, you are right: there are more buildings in Calgary now than there were 125 years ago, but this has nothing to do with regional flood frequency. But if I am missing some connection between flood frequency and the different number of buildings in Calgary, I would be happy for you to explain that link to me. The only major impact of building construction to flood frequency is the extent to which the land-cover changed, although landcover change creates local impacts, and the flooding wasn't only occurring within Calgary, which means that land-cover change wasn't the significant driver of this flooding event. But again, if I'm wrong on the facts here, please let me know.

As for the growth of cottonwoods vs. bow reeds, I was not making any claim about the actual biodiversity in the region, only responding to the claim by Luke that the large floods are somehow normal, because the name cites bow reeds, and bow reeds grow in floodplains, and - as evidence of flooding - Luke points only to extreme flooding events instead of a natural frequency of flood-plain inundation. Still, this doesn't change the general point of linking the comment to the flood-plain inundation rate and not the historical maximum flood rates, because although I am not a plant ecologist, the species of cottonwood I am familiar with tend to grow in/near floodplains and (especially in more arid regions) rely heavily on the periodicity of flood-plain inundation. Therefore, whether it's bow reeds of cottonwoods, it's the flood-plain inundation frequency (and not the historical maximum flood volumes and rates of flooding) that are more important in understanding those local ecosystem dynamics. (Although, to be fair, extreme floods do have a significant effect in shaping certain constraints to ecosystem structure, but the temporal scale of their impacts are at a completely different scale than the flood-plain inundation rates, which are far more important for year-to-year survival and propagation. This is the case for most flood-plain ecosystems, and I'm assuming that those in Alberta are no different in these broad-brushstrokes.)

Also, I agree with your point that the flood was predictable, and - in that sense - as normal as any large and predictable flood would be in the course of the history of a location. I am hesitant, though, to say that it's "normal," since the idea of "normal" is different when speaking about flood frequency and speaking in a day-to-day context. To most people, the idea of "normal" tends to be in the "happens regularly within a time frame that I happen to expect it to occur within (which usually extends to a maximum of "my life so far")". Therefore, while a 100-year flood, 500-year flood, or 1000-year flood occurring at some time in the history of a river system is "normal" in the grand-scheme of things, to most people, that particular event wouldn't be seen as "normal", since it didn't happen in their lifetimes (and if it did, then it wouldn't be "normal" since multi-century events "shouldn't" happen more than once in their lifetimes, even though - statistically - they could, and would be perfectly "normal" from a flood-frequency perspective).

Finally, to shift the discussion to where I infer that you're implying that I'm "follow[ing] the climate alarm industry's script", let's step away from the label-placing and automatic assumptions and speak about how climate change will affect the reliability of current flood frequency statistics. Flood frequency is based on a statistical probability based on past events, and this is fine, so long as current climate is adequately described by past climate. In general, though, climate change is expected to significantly alter flood frequencies in many places. Therefore, methodologically speaking, a future with altered climate makes using flood frequencies that were established on historic data methodologically troubling at best (and - if a region's climate has changed dramatically - it makes them completely useless).

Again, if I get anything wrong here, please do let me know. I'd be happy to have a discussion with you about them and to correct my knowledge and expectations.
I won't hold my breath to see if there's a response.

Tuesday, June 25, 2013

"Did climate change cause storm X" is the wrong question to be asking.

Treehugger has a story titled, "Did Climate Change Cause the Alberta Flooding?" Although the short article was decent, it leads with a question - the general form of, "Did climate change/global warming cause weather catastrophe X?" - that is misguided in its construction. Let me explain.

"Climate change" is talking about the shift from the historic climate regime into a different (ahistorical) one. That is all. Different areas (e.g., Toronto vs. Denver) have different climates, but they still do share some weather events (e.g., snow, wind, rain). However, the likelihood of one type of weather event happening is more an issue of climate.

However, what's makes this complicated is a conflation of the actual incidence versus the likelihood of the incidence. For example, if there is a 10% chance of rain for a particular date, and then it does rain on that date, the statistical likelihood of rain remains at 10%, even though the actual incidence of rain is 100%. Why? Because these are measuring different things. To use a baseball analogy, let's look at the Blue Jay's Adam Lind who has a .337 batting average and 30 RBIs for 202 at-bats so far in 2013. This means - all things being equal - he will get on base about 1/3 of the time and - of those times that he gets on base - his hit will allow someone(s) to score about 1/3 of the time. (That's pretty darn good.) Okay, now let's say that at his last at-bat, Lind hit a grand-slam home-run. (Congrats to Lind in this hypothetical case!) Now the analogous question: "Did his batting average and RBIs cause the grand-slam home-run?" That's a nonsensical question, and the only way you can really answer it is, "no, Lind's batting average and RBIs did not cause the grand-slam home-run." And - with baseball - we understand why that question doesn't make sense to ask. When it comes to climate change, though, we don't understand (yet) why the question is the wrong question and why the answer given by climate change deniers (as well as climate change scientist) are both, "No," or, "We can't say for sure." (This last response more often from scientists.)

A better question is, "How much has the likelihood of something like storm X occurring changed from its historical condition?" To use the baseball analogy one more time, this form of the question is more similar to the question of, "How have Lind's batting average and RBIs changed compared to his average before he was sent down for a time in the the Triple A's (i.e., his "historic batting average")?"

Previous entries explaining the difference between climate and weather: here (also using the Blue Jays), here, and here.

Previous entries looking at the implications of a change in the underlying incidence rate of floods: here and here.

Saturday, December 08, 2012

Saturday Omphaolskepsis: They aren't the oldest trees in the world, but...

In reading through my news items for today, I came across an article describing the fragility old trees in a changing climate:
A report by three of the world's leading ecologists in today's issue of the journal Science warns of an alarming increase in deathrates among trees 100-300 years old in many of the world's forests, woodlands, savannahs, farming areas and even in cities.
The reason behind this increased rate of die-off among old trees? Well, it's not only because the trees are reaching the end of their lives (some trees can live for several centuries, after all), but because the environments in which these trees live are changing. And why is this happening? Well:
"According to one popular theory, trees get a double-whammy when the thermometer rises. "During the day, their photosynthesis shuts down when it gets too warm, and at night they use more energy because their metabolic rate increases, much as a reptile's would do when it gets warmer." With less energy being produced in warmer years and more being consumed just to survive, there is less energy available for growth. "This hypothesis, if correct, means tropical forests could shrink over time," Professor Laurance said. "The largest, oldest trees would progressively die off and tend not to be replaced. Alarmingly, this might trigger a positive feedback that could destabilize the climate: as older trees die, forests would release some of their stored carbon into the atmosphere, prompting a vicious circle of further warming, forest shrinkage and carbon emissions."
In Saginaw Forest, we don't think of the trees as being particularly "old" - at least I doubt that many people think of Saginaw Forest as some sort of primeval wood, but it's important to remember that some of the trees on the property have joined the century club, having been planted waaay back in 1904. And these trees are dying off, although whether it's due to being planted too close or due to physiological exacerbations caused by climate stress (since many of these old Saginaw Forest trees are actually native to more northerly regions of the state), I can't say.

Still, it's something to think about when you're walking through the forest, recalling (in some deep recess of your mind) that you are walking through a forested landscape that - while not a "natural" forest - is in the range of 60-100+ years old. It's still a relatively "new" forest in that way, having not "matured" to be dominated by the climax community that we would have experienced way back in the early 1800s: a hardwood forest of oak, maple, and beech. It may also be sobering to recall that - thanks to climate change and the changed driving forces that our new and future climate have on the local ecology - Saginaw Forest will not be changing to resemble that 1800s forest of Southeast Michigan so much as a forest that would have been more typical of central Ohio.

In sum - and to bring it back to the topic of the paper - the century-plus old trees on the northern side of the property will likely die faster now than they would have if the climate hadn't changed, that those trees will also be more quickly releasing their stored carbon into the atmosphere, and that those reaches of the property are on a destined path toward a climax forest that would have been more recognizable around the Columbus, OH of 1800 than the Ann Arbor, MI of that same time.

Thursday, September 27, 2012

Thursday Thoughts: Regional Regional impacts due to Arctic melting: The future doesn't look anything like the past

Out of the University of Wisconsin - Madison, there is a brief on the potential future impacts of climate change on the region. (Well, the statements are about Wisconsin, but the impacted areas are definitely not going to stop at the Wisconsin state line.)
Vavrus, an expert on the arctic climate, says the dramatic melting trend is due to rising concentrations of greenhouse gases in the atmosphere warming the planet. He says natural variability may have accelerated the loss of ice in recent years, and he adds that the far north has physical characteristics that make it more sensitive to warming than other parts of the globe.

For one, he explains, snow and ice that normally cover the region reflect most incoming solar radiation back to space, but increased melting exposes land or ocean water that absorb more solar energy and accelerate any warming trend.

In addition, the lowest layer of the atmosphere in the Arctic is thin and prone to temperature inversions that hold warmer air near the ground, promoting even more melting as the region warms.

Vavrus says the Arctic is likely to continue to see pronounced downward trends in sea ice, snow cover, glacier extent, and permafrost. He says that will have major impacts on both natural ecosystems and human communities in the northernmost latitudes.

But the impacts of a warming Arctic could also be felt far beyond the region, including in the Midwest, according to research conducted by Vavrus and his colleague Jennifer Francis at Rutgers University published in the journal Geophysical Research Letters last spring.

"We believe that the winds aloft at the level of the jet stream will weaken and lead to slower-moving and 'wavier' atmospheric circulation patterns," he explains. "Such a change would favor more extreme weather events in middle latitudes, such as heat waves, droughts, floods, and—ironically—cold snaps."
What this means is that we can expect more weather patterns like what we saw this year: warmer winters, warmer springs, warmer summers, less rain on average, more rain in concentrated events, sudden cold snaps; you know: nothing like it used to be.

For Saginaw Forest, this will mean continued take-over by vines, continued lowering of the lake level, accelerated death of pine species, and rapid changes in the plant communities (as well as the insect, amphibians, reptiles, mammals, and birds that live in the forest). Furthermore, if lake levels get any lower than they are now, the near-shore habitat will be completely out of the water, severely limiting the available area for the fish currently in the lake to spawn, thus potentially causing a decline in the total number of fish in the lake.

... good times.

Saturday, August 11, 2012

Saturday Omphaloskepsis: Hottest July in recorded US history

By now, you might have read the stories about July 2012 being the hottest in recorded US history. If not, here's a news story on that point:
U.S. scientists say July was the hottest month ever recorded in the Lower 48 states, breaking a record set during the Dust Bowl of the 1930s. They say climate change is a factor. And even less a surprise: The U.S. this year keeps setting records for weather extremes, based on the precise calculations that include drought, heavy rainfall, unusual temperatures, and storms. The average temperature last month was 77.6 degrees (25 Celsius). That breaks the old record from July 1936 by 0.2 degree, according to the National Oceanic and Atmospheric Administration. Records go back to 1895. "It's a pretty significant increase over the last record," said climate scientist Jake Crouch of NOAA's National Climatic Data Center In the past, skeptics of global warming have pointed to the Dust Bowl to argue that recent heat is not unprecedented. But Crouch said this shows that the current year "is out and beyond those Dust Bowl years. We're rivaling and beating them consistently from month to month."
What's worse is that this is not a single year anomaly, but a continuing trend over the past two decades.

This is troubling for many, many, many reasons, including the very "small" one of continued life on this planet.

Monday, August 06, 2012

Monday Musing: Can we pre-empt the mis-use of a scientific study?

Just in case you have been out of touch with the social interplay between the science of global warming, the science of the impacts of global warming, and the American public perception of global warming, let me just make the understatement that the American public aren't scientists, and - if the "debates" over intelligent design/creationism and evolution back in 2005 (and the out-fall from the court case) are any thing to go by - it might be important to make sure that the scientific definition of theory be made absolutely clear and absolutely evident in all cases. Give people who are predisposed to believe a particular narrative, and they'll do it. (Everyone, including yours truly. I'll admit it, because I'm only human.) Therefore, when I see an article entitled "Climate warming refuted as reason for plant shifts in high-profile 2008 study," I'm interested for both content and social implication reasons.

Looking through the study, I found that the title is misleading. In fact, the study an in-depth review of a previous study about one species of plant in one location, showing that climate change was likely not the reason for why this one species in this one location actually showed the impacts that it did. Indeed, the PhysOrg article actually points out that the authors aren't saying that climate change doesn't influence plant shifts:
“I want to be clear that I’m not saying climate change isn’t happening or having effects,” Schwilk said. “I study it all the time. But we’re trying to have people be more explicit about describing the mechanisms and causes of plant shifts, because I suspect there may be a bias toward automatically assuming climate change as the reason.
You see there? One of the two authors is explicitly saying that he does believe that climate change does influence plant-shift patterns, and that - like many good scientists - he wants to ensure that people look more closely at the interlinkages and not rely too heavily on simple models.

In short, on the social implication side, this study isn't actually one that debates the theory of global warming or even the theory of plant shift due to global warming. It is - to reiterate - a report that investigates one report about one plant species in one location. Therefore, if you see this study being cited in the future as proof against climate change not having an impact on plant species, then know that the person telling you this is feeding you a falsehood. Don't bite.

Full PloS ONE article here.

Friday, July 27, 2012

Photo Friday: Drought and a comparison of summers

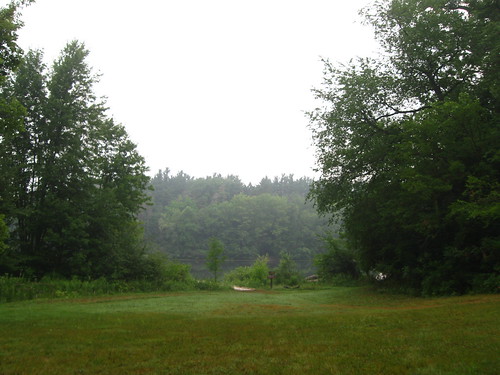
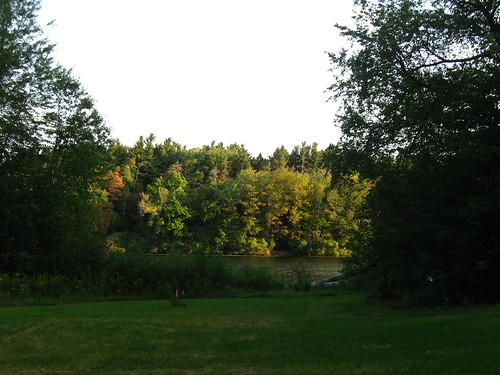
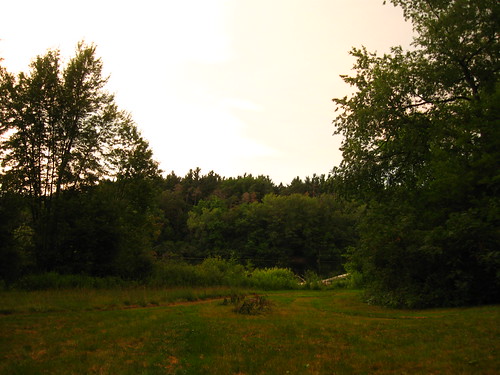
Just like the comparison of "winter" this year and previous ones, it's interesting to look at the condition of this year's drought conditions. The front lawn area is where this year's drought is most evident. The brown lawn looks more like something one sees in California than what one would expect in southeastern Michigan.

From Thursday morning (July 25, 2012):
IMG_3223

Compare it with July 23, 2011:
IMG_9346

September 7, 2010 (couldn't find a photo from the end of July):
Start of fall colors

July 23, 2009:
IMG_0637

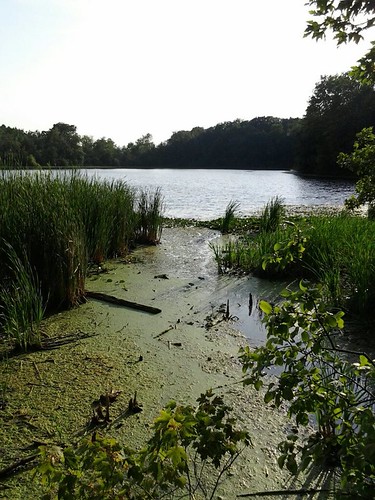
And although the lake appears to continue to be nice and blue and stable, it actually has continued to drop quite precipitously (considering that it's a spring fed lake and all). To wit:

On Thursday afternoon (July 25, 2012), you can see the matted bottom starting to show through the algal mat:
Low water level on TSL

whereas two months ago (May 25, 2012) it was a channel deep enough for it to be a usable fish passage:
IMG_3053

Thursday, July 26, 2012

Is Michigan to Become the "Buckeye State"?

Living through this summer of far-hotter-than-normal days in Ann Arbor - home to the University of Michigan Wolverines - and working in environmental and natural resource management, I am thinking about the on-the-ground effects of climate change more than often. (Maybe more than is healthy.)

I hope for rain. I hope for cool winds. I hope for clouds even.

We get heavy sun that heats up asphalt, withers trees, and browns the grass. We get hot gusts of dry wind that buffet you into sweat-stained submission. We get few clouds, and those we get rarely carry rain for us.

It's the largest drought area ever declared, but some people are wondering if this is a forecast of things to come, or even the new normal. However, people from Mississippi River managers to Michigan cherry crop farmers to almost anyone paying attention in much of the country is recognizing that there is a massive drought happening and that weather has gone haywire (unless you happen to be Newton Leroy Gingrich).

And these are just the things that are happening right now. For University of Michigan fans, things could well get much worse.

According to research done in 2007 by Daniel McKenney and colleagues, the Ohio buckeye - which is the state tree of Ohio as well as the mascot to Ohio State University - will be shifting northward over the next 100 years. This means they will be shifting into Michigan, moving fromcurrent distributionand possibly into Michigan (according to the CSIROmk35 A1B prediction model)

This will turn Michigan into the new "Buckeye State" (and buckeyes have been growing quite happily in Saginaw Forest for a few years now), which might well get a lot of Michigan (and Michigan State) fans quite angry about the whole thing, and maybe start to think of climate change as something real. Yes, it's a strange way to introduce people to the effects of climate change, but many people have visceral attachments to sports, and for many people this includes university sports (even if they never attended that particular university).

What might make this an even greater blow for University of Michigan fans is that the last known wolverine living in the state died in 2011. With the death of the wolverine - the UofM mascot - and the encroachment of their largest rival's mascot onto home territory, could there be some sort of climate change education and action that come out of this?

While part of this is written as tongue-in-cheek, another part of me is trying to think of ways to get people latched onto simple fact that climate change is not just happening right now, but has been happening for decades already; that the time to act is not tomorrow, but yesterday; and that the fact we haven't done a lot is only going to require us to work all the harder down the line.

Tuesday, July 17, 2012

Warming temperatures leading to additional lake complications?

This past winter, Third Sister Lake didn't get a complete freeze, and it was possible, as the spring approached, to see algae growing in some of the ice. In March, while we were experiencing temperatures normally part of June weather, I wrote about some of the possible impacts that such weather might bring if they become the norm. I also wrote about some of the possible impacts to Third Sister Lake that such warming might bring.

Well, add to all that one more impact brought on by warming: decreased lake turnover. In a new paper out in the journal Climate Change, Swiss scientists have shown how increased warming in Swiss lakes have decreased lake turnover, and this has brought about increased levels of Burgundy blood algae.

The paper's abstract states:
Anthropogenic-induced changes in nutrient ratios have increased the susceptibility of large temperate lakes to several effects of rising air temperatures and the resulting heating of water bodies1. First, warming leads to stronger thermal stratification, thus impeding natural complete water turnover (holomixis), which compensates for oxygen deficits in the deep zones2, 3. Second, increased water temperatures and nutrient concentrations can directly favour the growth of harmful algae4, 5, 6. Thus, lake-restoration programmes have focused on reducing nutrients to limit toxic algal blooms7. Here we present evidence that the ubiquitous8, 9, 10 harmful cyanobacterium Planktothrix rubescens has become the dominant species in a large lake during the past four decades, although the phosphorus content of the ecosystem decreased fivefold. However, the nitrogen input was not diminished concomitantly, favouring this non-N2-fixing cyanobacterium owing to increased N:P ratios10. P. rubescens contains gas vesicles that allow for buoyancy to accumulate within the depth of optimal irradiance11. As the toxic cyanobacterium has low consumption by predators12, water turnover represents the main mechanism of seasonal population control. Thus, unidirectional lake-restoration measures13 in parallel with recurrent absence of holomixis owing to lake warming may lead to similar undesired effects that have formerly emerged from fertilization.
This type of impact is problematic for Third Sister Lake, not because of Planktothrix (or because of other cyanobacteria, at least to my knowledge), but because Third Sister Lake is already a lake that doesn't completely turn over. From a 2001 paper by Bridgeman et al., the finding of lake stability (i.e., the resistance to turnover) in Third Sister Lake was that:
Salt-laden water entering Third Sister Lake [during the winter] from [the business lots to the southeast] could eventually lead to the formation of a chemocline. Large vertical gradients of salinity may potentially prolong stratification or altogether prevent mixing. ... If Third Sister Lake follows a similar pattern [to First and Second Sister Lakes], the contribution of a chloride gradient to stability would reach a maximum in March or April ... and the lake ... will remain [thermally stratified] until mid-November.
The paper also reported that - due to forest growth from 1904 - Third Sister Lake didn't fully turn over in the spring (i.e., following ice-out), even back in 1986. The authors of the 2001 paper concluded that:
Given that the lake is now more sheltered [than in earlier decades] and may require about 60% more wind energy to overcome a chlorine gradient, complete spring mixing, which was a common event at least into the 1940s and occurred occasionally until the early 1980s, is now probably rare.
And it's likely to remain rare if increased temperatures become the norm. (That is, unless a significant number of trees fall down, thus increasing the lake's wind exposure.)

Are vines growing faster?

Walking through Saginaw Forest this summer, I have noticed far more vine growth than I recall there being in previous years. Is this just my imagination? Confirmation bias? Or could it have something to do with the really warm winter that we had? (Too, could it have something to do with the differential rates of growth between vines and trees?)

What we know for sure is that the winter of 2011/2012 was a really warm one and March, May and June have been uncharacteristically warm, as well. There has also been less rainfall than usual.

Now, what I'm guessing at is that, since vines require less resources to maintain themselves and grow compared to trees, it seems possible to me that vines have been able to quickly take advantage of the warm spring and start their growth while also being able to continue growing during these more parched months. However, this is just a guess on my part.

What I know is that there are a lot of trees with vines growing on them; the vines themselves are very dense, and there's a lot of poison ivy, too. This radically warm winter, spring, and summer seem to correspond with the basic message of a 2006 paper by Mohan et al. Their abstract reads, in part:
Contact with poison ivy (Toxicodendron radicans) is one of the most widely reported ailments at poison centers in the United States, and this plant has been introduced throughout the world, where it occurs with other allergenic members of the cashew family (Anacardiaceae). ... Rising CO2 is potentially responsible for the increased vine abundance that is inhibiting forest regeneration and increasing tree mortality around the world. In this 6-year study at the Duke University Free-Air CO2 Enrichment experiment, we show that elevated atmospheric CO2 in an intact forest ecosystem increases photosynthesis, water use efficiency, growth, and population biomass of poison ivy. The CO2 growth stimulation exceeds that of most other woody species.
So, poison ivy is expected to be more abundant and a greater lover of the high CO2 future than trees. And this is likely also a cause for the increase vine abundance in general.
We heard news a few months back that the atmospheric concentration of CO2 has increased past 400ppm, which doesn't correspond to the elevated CO2 chambers of Motan et al's study, but as the Motan paper discusses previous studies on increased CO2 and vine growth:
With an increase in CO2 concentration and a corresponding increase in photosynthesis, vines can allocate more photosynthate to additional photosynthetic tissue, because of a low allocation to support tissue relative to other woody growth forms (13, 14, 18, 19). Increasing abundance of woody vines is causing increased tree mortality and reduced tree regeneration in forests around the globe (18, 20–23), potentially resulting in shifts in community composition that may impact carbon cycling and biodiversity (23). Although it is unclear how elevated CO2 will affect the growth of vines in forest environments, the contemporary increase in woody vine abundance may be the result of rising atmospheric CO2 concentrations (19, 23).
The Motan et al paper doesn't discuss the impacts of warmer winters, springs, and summers on poison ivy growth (nor on the growth of other vine species). However, I am going to guess that a large part of the vine growth this year is likely due to the ever increasing CO2 levels and have been exacerbated this year by the unnaturally warm seasons.

Friday, July 13, 2012

Rivers are apparently not warming due to increased atmospheric warming

... at least not in all Pacific Northwest rivers, according to available data.

In a recent paper ("The paradox of cooling streams in a warming world: Regional climate trends do not parallel variable local trends in stream temperature in the Pacific continental United States"), Arismendi et al provide a description of what's happening to stream temperature trends vis-à-vis air temperature trends. (That's pretty obvious, because it's in the title of the paper; yay to the descriptive quality of scientific papers.)

In the paper, Arismendi et al describe the importance of water temperature in stream ecology, and provide a brief review of the theory of stream warming and a critique of the quality of existing corroborative, data-driven research:
Observed warming in air temperature (between 0.8 to 2.1°C for the first half-decade of the 21st century relative to the period 1950-1980) [Hansen et al., 2006] and changes in streamflow timing and magnitude [Mote et al., 2005; Regonda et al., 2005; Luce and Holden, 2009] have been hypothesized to lead to increases in the magnitude and variability of stream temperature. Several studies have noted increasing temperature of streams. However, these have been based on data from streams that include those altered by human influences, including impoundments and water withdrawals [Kaushal et al., 2010; Mantua et al., 2010], or through inferences and correlations derived from air-water relationships [Mantua et al., 2010; Isaak et al., 2011]
The authors point to an interesting trend in the stream temperatures of 63 sites in northwestern Pacific coast of the US: some are cooling, even as the air temperatures are rising even while others are warming, but most showed no variability in water temperatures. In the end, few stream sites conformed to the initial hypotheses of both (A) increased temperatures and (B) increased variability in temperatures.

In their conclusions, the authors point to a variety of potential causes:
  • Variability in stream shading over the record period
    • Even though correlations between baseflow and riparian vegetation seemed to show counter-intuitive results
  • Variability in results derived from long vs. short record periods
    • Longer term records are more robust, but there are very few long-term records for minimally impacted streams.
  • Local driving factors that overpower any theoretical relationship between warming air temperatures and increasing stream temperatures
The authors conclude that there need to be far more stream gaging stations, and - as someone who likes greater amounts of data - I have to agree. Still, I wonder if the study could have been improved by - instead of asking for greater amounts of stations in the Pacific Northwest - looking at a greater number of stations across the nation. (I mean, the USGS provides a lot of data for many hundreds of stations around the country.)

Friday, June 15, 2012

Normalizing CO2 emissions makes little physical sense (at least to me)

I have written about some of the problems of normalizing CO2 emissions (here, here, and here), and I don't really understand the reasoning behind it, other than to make a policy statement. Indeed, because we live in a world that has dominant social systems that govern the physical systems, we must recognize the importance that such framing has in policy statements and decision-making.

We must recognize that China - although the world's largest emitter of CO2 - has a far lower per capita CO2 emission than the United States. However, the physical world doesn't care about this normalization, and as China has pursued their economic growth through completing about 1 coal fired power plant each week, its economic costs due to coal and industrial pollution are draining an increasing amount away from that growth.

We must recognize that countries that divide their CO2 by their GDP also show some sort of "CO2 efficiency" in their economy. However, the physical world doesn't care about this normalization or any concept related to it.

To the physical world, one ton of CO2 emissions is the same as any other single ton of CO2 emissions, whether it is emitted from China, the US, or Botswana; whether it's emitted due to respiration, cooking fires, or industrial emissions; whether it's for economic gain in country A or in country B. An economist might look at this and say, "Hey, this is a great reason for applying an opportunity cost assessment here," but - you know what? - the physical world doesn't care about opportunity costs, either.

With all that recognition, we now have a new study - from the University of Michigan's Transport Research Institute - that shows that the US's CO2 emissions don't fare "as bad" when you account for heating degree days (and cooling degree days).
Sivak and UMTRI colleague Brandon Schoettle say that some rankings adjust the total amount of emissions to account for the size of each country's population (per capita) and its overall economic output (per GDP). But they believe it's important to go one step further: account for the general heating and cooling demands imposed by the climate of a given country because climate control produces carbon dioxide emissions.
The justification for this is not really clear. Are they doing this based on the assumptions that we will have climate change, and then people might be using energy differently? If so, the article doesn't actually say how or what climate change scenarios are assessed. If it's looking at how current energy is used based on current climate, then it's double-counting types of efficiency, since part of those costs would be included in GDP measures.

What gets me most, though, is the final paragraph of the article:
"Overall, our results suggest that taking climate into account makes a significant difference in how countries fare in carbon dioxide emissions rankings," Sivak said. "Because people respond to the climate they live in by heating and cooling indoor spaces, an index that incorporates climate provides a fairer yardstick than an index that does not."
Ummm.... How does Sivak define, "fairer?" If one is concerned about total emissions' impacts on the world and on global climate change, then his argumentation makes no sense, because the physical world doesn't care about this normalization. In fact, as I stated above, the whole idea of normalizing based on per capita or per GDP makes little physical process sense, except for the arguable forum of of public policy. However, that forum must divorce policy making and future scenarios from impacts from climate change in order for the argumentation to really work outside of an international setting. However, recognizing that policy may be divorced from the impacts of climate change doesn't justify normalizing by degree days.

Why not, for example, choose something else, like normalizing by weather variability (which is connected with major changes in local climate), by expected health care costs (since this has major direct and indirect impacts on GDP and per capita as well as speaks to a host of environmental changes), by security (since we can expect major changes in migration - and in nations' security - in a future with climate change), or by almost anything else than a triple normalization that included degree days?

Or maybe I'm missing some justification that makes sense that was presented in the article in Scientific American that I didn't see in the PhysOrg article. The way that it was presented in PhysOrg made it seem more like a "hey, don't hate on the US, we're better than you think when it comes to CO2 emissions*".

* When you normalize the data three ways to next century.

Monday, May 28, 2012

Tornado Tracks

Via Flowing Data:


John Nelson of IDV Solutions put 56 years worth of tornadoes on a map. John plotted each tornado's path and used brightness for its F-scale (level of intensity). He also added secondary charts for deaths and injuries and frequency by F-scale.

It makes a gorgeous map. I would love to see the data incorporated into the wind map.

So... practically speaking, if you live in the Midwest or Southern US, you should probably put this on your reading list.

Tuesday, April 17, 2012

Still in line to be a record year for tornadoes

Back in March, I made the following observation:
As of March 20st, the number of tornadoes in the US reached 285, which is almost tied for the most tornadoes on record by NOAA. (As a contrast, in a year that is at the 50th percentile, we wouldn't reach 285 tornadoes until roughly the end of April.) When looked at through the light of all the record temperatures, it's not too surprising that so many tornadoes are happening, but it's also very little consolation that warmer temperatures means better times.
The warm weather is basically still happening - although not at the record-breaking pace set in March. Still, though, the pattern of having a lot of tornadoes is also continuing, and - as of April 16, 2012 - we are 462 tornadoes (compared against the maximum value of 480). That's a figure that - on a median year - wouldn't be reached until mid-May. Therefore, we're still accumulating more tornadoes. Just for reference, the median yearly number of tornadoes (Jan 1 - Dec 31) is 1297. That value is - on the maximum year - recorded on roughly July 1st, and - so far - our trajectory is looking to hit 1300 around Independence Day...

It's weird weather. It's here, and we have to live with it.

Wednesday, March 21, 2012

The winter that never came, and what it might mean

Well, I pointed out back in January that the winter - at least the version one could expect in Ann Arbor, MI - wasn't actually here. Then, through February, we waited for winter to come, and - other than a couple of dips in the temperature and some snow that lasted a couple of days - we continued to remain stubbornly above freezing on most days.

Now, in March, the trees are trying to catch up with the temperatures that closer to what is typical of late June than anything close to what we would expect in March, let alone April (we could reasonably expect 82F/28C temperatures in May, but they are historically rare). In short, the temperatures we are experiencing in Ann Arbor are presently CONSISTENTLY SHATTERING all historical measurements (all the days from March 14 through March 21, 2012 have broken the previous high-temperature record, and the current forecast expects that March 22 and 23 are also going to be record-breakers, which - if true - means that there will be nine full days of record-shattering temperatures).

"But it's not TOO hot," and, "I LOVE this kind of weather," I hear some people say. Well, true: temperatures of 70-80F are quite comfortable, and it's no surprise that we'd love the temperatures that we (likely) evolved to thrive in. Such high temperatures, do, however, bring drawbacks.

The insects are also loving it - I've been having mosquitoes in Saginaw Forest for the past two weeks, and the moths and mayflies are starting to emerge. The frogs, too, are quite happy, singing up a storm in the evenings, but their choruses are already starting to die down. I wonder how long the summer temperatures will hold this year: will we remain (relatively consistently) above 70F from now to late September? Will we again get up past 100F in July? Will we again have a rain-stressed year? (I also wonder if the weather will suddenly remember that it's only mid-March and dip back into the "average" temperature range of lows in the low-30s and highs in the mid-40s.)

I know that this isn't (necessarily) climate change upon us. It is (and has been) a bitterly cold winter in Europe, after all. However, if this year is anything to use to predict some likely occurrences in a warmer climatic future, then I hope that people are paying attention. What starts as "nice temperatures" turns into "bad weather" as the high level of heat energy in the atmosphere brings about earlier and more intense storms than what our experience has led us to expect. In the Ann Arbor region, this meant a tornado touching down in Dexter, combined with intense rain (over 1" of rain in 1 hour at Ann Arbor airport) and hail, which caused flooding in Ann Arbor (as both storm and sanitary sewers became flooded beyond capacity), massive erosion along rivers (as they "endeavored" to accommodate the massively increased flows of water), and felled trees (thus knocking out electricity for thousands as well as destroying more property).

Looking more regionally, we have seen the start of one of the earliest tornado seasons on record. According to MNN.com:
In the U.S., tornado season tends to move northward from late winter to mid-summer. In Southern states, tornado season is typically from March to May. In the Southern Plains, it lasts from May to early June. On the Gulf Coast, tornadoes occur most often during the spring. And in the Northern Plains, Northern states and upper Midwest, peak season is in June or July.
As of March 20st, the number of tornadoes in the US reached 285, which is almost tied for the most tornadoes on record by NOAA. (As a contrast, in a year that is at the 50th percentile, we wouldn't reach 285 tornadoes until roughly the end of April.) When looked at through the light of all the record temperatures, it's not too surprising that so many tornadoes are happening, but it's also very little consolation that warmer temperatures means better times.