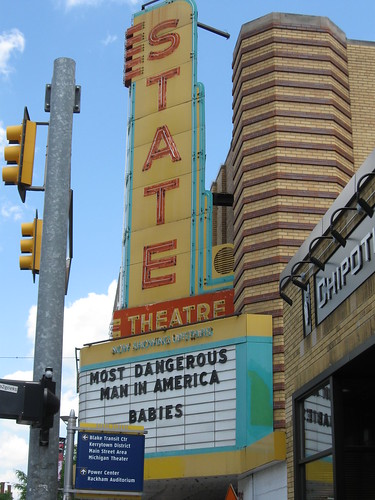
 Now, does this mean that babies are the most dangerous man in America, or that the most dangerous man in the world has something to do with babies?
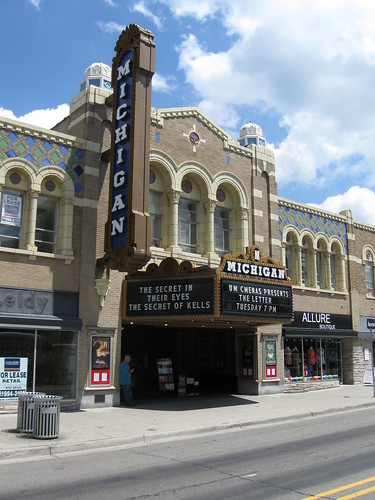
And why is the Michigan Theatre being SOOOO secretive?
Now, does this mean that babies are the most dangerous man in America, or that the most dangerous man in the world has something to do with babies?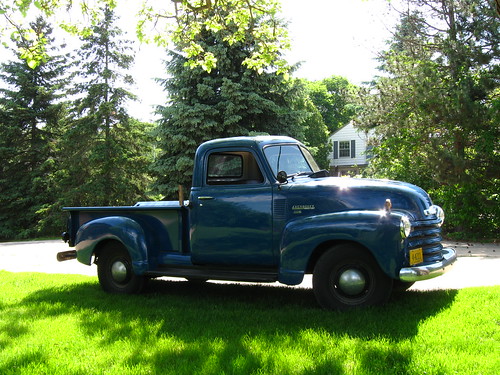 Bill's got a 1952 Chevy pick-up truck. He tells me that he found it out in Colorado, in a barn, undriven for several decades. It runs like a dream, too, and can (apparently) haul a LOT of weight when in first gear. (Apparently much more than modern light trucks.)
1590s, from Fr. bigot (12c.), in O.Fr. "sanctimonious;" supposedly a derogatory name for Normans, the old theory (not universally accepted) being that it springs from their frequent use of O.E. oath bi God. Plausible, since the Eng. were known as goddamns in Joan of Arc's France, and during World War I Americans serving in France were said to be known as les sommobiches (see also son of a bitch). But the earliest French use of the word (12c.) is as the name of a people apparently in southern Gaul (which led to the now-doubtful, on phonetic grounds, theory that the word comes from Visigoth). Sp. bigote "mustache" also has been proposed as a source, though the sense is not adequately explained. The earliest English sense is of "religious hypocrite," especially a female one, and may have been influenced by beguine. Sense extended 1680s to other than religious opinions.
State education officials say the move is intended to ensure that students with limited English have teachers who speak the language flawlessly.See?!? It's not racist! They are "just trying to help" those students with "limited English" (who might be having to go back to their "home countries" because of the immigration law that AZ passed, but let's not talk about that, because obviously the two are not related).
I don’t say I hate every Black person, but the majority. . . . I don’t consider myself a racist. I, when I think of the word racist, I think of the KKK, people in white robes burning people on crosses and stuff.If the definition of "racist" was epitomized by the KKK, then this interviewee -- not being a member of the KKK -- isn't a racist; no matter her viewpoints. If one looks only at one of the recent three governmental actions in Arizona, one might not (if one were generous) say that it was overtly racist, since it doesn't single out one racial group (i.e., it isn't definitionally racist). However, looking at the implication of the law, especially in conjunction with these more recent actions in education, then the actions do seem to be increasingly supportive of the idea that the policies are racist. To that end, I think that the discussion points of the study by O'Brien, et al. is really quite enlightening:
Many people believe that exposing White Americans to information about the prejudice that ethnic minorities encounter is a surefire way to reduce prejudice. Videos that demonstrate prejudice are a mainstay of multicultural education programs (e.g., HumaNext, 2005; Western States Center, 2005) and social psychology classes. White Americans are largely ignorant about the pervasiveness of the prejudice faced by ethnic minorities (Adams, O’Brien, & Nelson, 2006), and conventional wisdom suggests that if Whites were more educated about this prejudice, then they would act to end prejudice.
[However,] the results of the current research suggest that the results of prejudice education may not be so straightforward. At least among White Americans, the primary reaction to media portrayals of racism may be for people to distance themselves from the racists, while patting themselves on the back for their superiority. In Experiment 3, participants who watched a documentary about prejudice showed no increase in their perceptions of the commonness of prejudice. Although we found evidence that watching the video decreased prejudice toward Black Americans, a seemingly positive outcome, it also increased positivity toward White Americans. These synchronized increases in positivity toward White and Black Americans allowed participants to maintain their preference for Whites over Blacks, while simultaneously feeling more innocent of actual prejudice; not the preferred outcome of multicultural educators and tolerance workshops.
… The finding that learning about White racism increases liking of White Americans seems to defy logic and can only be understood in terms of defensive processes activated among White Americans who are exposed to what is apparently threatening information about their group and their social system…
The paradox of how White Americans simultaneously act in prejudiced ways while viewing themselves as unprejudiced has long puzzled social scientists (e.g., Dutton & Lake, 1973; Dutton & Lennox, 1974). The present research suggests one reason for the existence of this paradox: The predominant social representations of prejudice available in American culture provide people with a source of social comparison information. When White Americans compare themselves to these social representations, they tend to view themselves as relatively unprejudiced.
Furthermore, the present research suggests that, at least on some occasions, people deliberately seek out exposure to these representations of prejudice in order to reduce threats to their unprejudiced self-images. This self-protective strategy may serve to make White Americans comfortable, but it may also create the space for them to convince themselves that their failings are minor, and that as long as they do not join the Ku Klux Klan or start burning crosses on people’s lawns, they’re doing just fine.


And, sources for those of you interested:
Life expectancy: Study: U.S. Slipping Down Life Expectancy Rankings, Life Expectancy Wiki
Democracy index
Freedom of the Press index as reported by Reporters Sans Frontières
Internet Speed: US ranks 28th in Internet connection speed and World Results by Speedtest.net
Prison Population
Corruption Perception Index, Also reported by Transparency International
Quality / efficiency of education
Cell Phones Per Capita: Nation Master
Child Mortality Rates: Reported by the UN
Health Care Rankings done by the World Health Organization (WHO)

This seems like a fairly fatal flaw. My understanding is that the only reason that the US workforce is increasing in numbers (unlike European and Japanese workforces) is because of immigration. Or do you mean “only legal US residents”?True, I'll admit that it was the only one that I didn't explicitly explain, however, if he had taken time to look at how I was doing my estimation, I the that he should have been able to figure out why I was making that assumption. (Plus, it's a back-of-the-envelope calculation, for eff's sake!)
I assumed that only US citizens are working because I only did a search for the US population and the US population growth. These numbers only include US citizens, and not legal and illegal workers. Therefore, the assumption needed to be made that only US citizens were working, given the numbers that I had.I await his response (hopefully with a monthly growth in foreign workers number).
Again, it’s a back-of-the-envelope calculation. I clearly stated my assumptions. I clearly stated that this means that the figure of 255,339 adults added per month has wide errors (especially given my assumption that only US citizens are working).
What more do you want from me? If you have the information about the growth rate in foreign workers in this country, then by all means let me know what it is, and I’ll add it to the calculation.
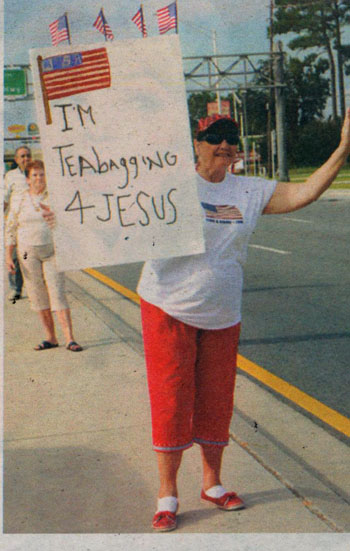
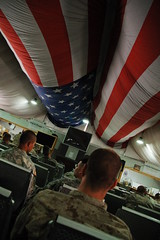
Okay... So let's look through section 8 one by one. The protesters of the "disrespect" to the flag aren't seen (to my knowledge) in doing (a), and although I'm not sure that (b) really can work if the flag itself its merchandise, I don't think that it is generally done by "Flag coders", although with September 11th flag mat, one does have to place it on the ground...§8. Respect for flagNo disrespect should be shown to the flag of the United States of America; the flag should not be dipped to any person or thing. Regimental colors, State flags, and organization or institutional flags are to be dipped as a mark of honor.
- The flag should never be displayed with the union down, except as a signal of dire distress in instances of extreme danger to life or property.
- The flag should never touch anything beneath it, such as the ground, the floor, water, or merchandise.
- The flag should never be carried flat or horizontally, but always aloft and free.
- The flag should never be used as wearing apparel, bedding, or drapery. It should never be festooned, drawn back, nor up, in folds, but always allowed to fall free. Bunting of blue, white, and red, always arranged with the blue above, the white in the middle, and the red below, should be used for covering a speaker's desk, draping the front of the platform, and for decoration in general.
- The flag should never be fastened, displayed, used, or stored in such a manner as to permit it to be easily torn, soiled, or damaged in any way.
- The flag should never be used as a covering for a ceiling.
- The flag should never have placed upon it, nor on any part of it, nor attached to it any mark, insignia, letter, word, figure, design, picture, or drawing of any nature.
- The flag should never be used as a receptacle for receiving, holding, carrying, or delivering anything.
- The flag should never be used for advertising purposes in any manner whatsoever. It should not be embroidered on such articles as cushions or handkerchiefs and the like, printed or otherwise impressed on paper napkins or boxes or anything that is designed for temporary use and discard. Advertising signs should not be fastened to a staff or halyard from which the flag is flown.
- No part of the flag should ever be used as a costume or athletic uniform. However, a flag patch may be affixed to the uniform of military personnel, firemen, policemen, and members of patriotic organizations. The flag represents a living country and is itself considered a living thing. Therefore, the lapel flag pin being a replica, should be worn on the left lapel near the heart.
- The flag, when it is in such condition that it is no longer a fitting emblem for display, should be destroyed in a dignified way, preferably by burning


Also, given how much the lines on the graph drastically zigzag (society cannot change from 20% acceptance one year to near 40% the next) around, I find it very hard to put much faith in the survey’s legitimacy.However, much of this can be explained by the fact that Will's depiction only showed the percentage of people who responded with an answer of 1 (i.e., "Never justifiable") as opposed to a 2 or 3 (which, out of a ten-point-scale, are still pretty close to "Never justifiable"). By grouping the other responses together into three classes, one can see how the shifts over time occur. In the following graph, each time period's survey responses are groups into four categories: Never (response=1), Low (response=2-4), Medium (response=5-7), and High (response=8-10):


 My initial comment of the graph was:
I look at graphs like this and wonder, “Where are the error bars?” (or range of errors)To this, one commenter seemed to wonder why I (and others) have recently been so critical of graphs, and (erroneously) stated that error bars weren't relevant. To which I answered:
If the increase in the number of blacks increased because of a relatively few really high-survival cases, this would be seen in the error bars. Similarly, if there is a lot of overlap between Blacks and Other, then it would imply that separating out the two might not be very useful in terms of a comparison.
Similarly, showing all the numbers on a linear-linear scale makes it difficult to see if no black children lived past one year-of-age in certain years, or if it is just a really small number. Using a linear-log scale would really help out here.
Basically, my gripe is that the graph — without error bars — doesn’t give a lot of information for comparative purposes, especially between “Blacks” and “Others”.
Another commenter was wondering what changes occurred during the 13 years after the graph data, and (as a procrastination measure) I looked around a little bit. In a paper (which requires a subscription), I found the following graph:The error bars you cite the lack of was not relevant in the study being done and thus were not included.And yet (and yet), you cite the 95% confidence interval… from which one could draw error bars. Apparently, the it was felt that the 95% CI was important enough to report, so perhaps they just didn’t know how to put it on the graph. (And considering the other problems they had with their visual representation, cited by me and others, it could just be that the authors didn’t know how best to do this, or their graphing software couldn’t do it very well.)
And why shouldn’t one be critical of the image being presented, especially since it presents (incorrectly, or — more graciously — obfuscatorily) data about a social effect? True, the point of the post is not the graph, but as others have pointed out, there is the problem of what a 0 means here. Is it “no data” or is it actually that no babies survived? Also, the error bars (or range of error) — which you erroneously state as not being relevant to the study — would really help interpret how the values between racial groups relate to each other.
But I turn the question over to you, Patrick: Why don’t you like it when people are so critical of presented graphs, especially when they point out obvious deficiencies of said image (on a blog about the sociological meaning and — I would argue — interpretation of images) that could alter how people interpret the meaning behind said image? (Especially since many of the recent posts are about graphs.)

