I hold out hope that winter will actually come; a real winter that dips the thermometer down to the single digits (in Fahrenheit, of course; double negative digits in Centigrade). A winter with snow, dry air, and (if I can wish) clear, bright, and frigid days. You know what I'm talking about: winter in Michigan.
I'm not asking for huge amounts of snow. (In fact, I would prefer not to have too much of it, since it makes cycling to the campus difficult.) I am, though, hoping - as the well-above-average-temperature days tick past - for cold enough weather to actually call these months "winter". As it is, 30 of the past 40 days of winter (counting back to the Winter Solstice) have been above the average temperature range, while only two have been below the average temperature range. In other words, 75% of the days this winter season have been above average, while 5% have been below average, leaving 20% within the average range of temperature. Furthermore, 25 of the above-average-temperature days or have been above freezing, and 15 of these days were above 40F (~4.4C). In other words, 62.5% of the winter days have so far been above freezing and 37.5% of the winter days have so far been above 40F!
My point is that this year's weather can't really be called "winter" for Ann Arbor... at least not in the sense of how it feels. It can technically be classified as on the warm edge of what a winter for this area might feel like, but I would suggest that even this would be a difficult stretch to make.
At least it isn't raining right now... At least the sun is shining and melting the snow (hopefully clearing it all up before any ice forms on the roads).
Tuesday, January 31, 2012
Captcha! Story
A short story that makes rather fun use of the random Captcha words that we often see online.
Captcha from Gabrielle de Vietri on Vimeo.
Via The Dish.
Listening to the story and watching the Captcha images (to confirm the nonsense word is actually a nonsense Captcha-generated word), it's interesting to cogitate upon the "flavor" of the word - how the author uses these words to so perfectly color and enliven the text of the story. Just like Lewis Carroll's "Jabberwocky," this one makes good synaesthetic use of the words to convey the feeling of what things are:
All this reminds me of the lessons that I learned waaay back in undergrad basic psychology about the fact that we all share some basic level of synaesthesia (yes, I'm using the British spelling, since that's how I learned it in the first place, and my fingers prefer to spell it that way on the keyboard).
We find it easy to read a colored word when the word and the color match:
but difficult when it's colored a different color than the word
We also share the "Bouba/Kiki Effect" in which people are given the nonsense names "Bouba" and "Kiki" (apologies to anyone names Bouba and Kiki) and told to assign the names to two blobs, one of which is angular and one that is rounded:

Captcha from Gabrielle de Vietri on Vimeo.
Via The Dish.
Listening to the story and watching the Captcha images (to confirm the nonsense word is actually a nonsense Captcha-generated word), it's interesting to cogitate upon the "flavor" of the word - how the author uses these words to so perfectly color and enliven the text of the story. Just like Lewis Carroll's "Jabberwocky," this one makes good synaesthetic use of the words to convey the feeling of what things are:
The redlemutes shuffled along silently. The mouthless creatures had no language, but desmodowe could tell they were sending vibes to each other in conspeali. He knew that if they conspealed too loud, they would awake the terrible manackboar, who would be sent into a frenzy by the rustiant scrape of the acithidoid's frequency, but that was the least of their worries..."Lines like this - although lacking the tradition that time imparts to resilient works of art - are so much like those found in Carroll's poem:
'Twas brillig, and the slithy tovesLinking this to Synaesthesia
Did gyre and gimble in the wabe;
All mimsy were the borogoves,
And the mome raths outgrabe.
All this reminds me of the lessons that I learned waaay back in undergrad basic psychology about the fact that we all share some basic level of synaesthesia (yes, I'm using the British spelling, since that's how I learned it in the first place, and my fingers prefer to spell it that way on the keyboard).
We find it easy to read a colored word when the word and the color match:
RED, ORANGE, YELLOW, GREEN, BLUE, PURPLE
but difficult when it's colored a different color than the word
PURPLE, BLUE, YELLOW, GREEN, RED, ORANGE
We also share the "Bouba/Kiki Effect" in which people are given the nonsense names "Bouba" and "Kiki" (apologies to anyone names Bouba and Kiki) and told to assign the names to two blobs, one of which is angular and one that is rounded:
Even cross-culturally (based on a 2001 study between American and Tamil college students), almost all assigned "Kiki" to the angular blob and "Bouba" to the rounded blog.
While I don't know what a manackboar looks like, the fact that it's colored blue makes me think of a manackboar that has not yet become frenzied (since I associate blue with calm). Analogously, the term conspeali, being written in bold red makes me think that it's somehow dangerous (since I also associate red with danger). In short, watching the story play out with the colors and nonsense words in context makes this story (and this is only the first chapter) an interesting one for the senses.
Monday, January 30, 2012
Insights about Minnesota lakes: implications about Third Sister Lake
Hopefully, no one is naive to the fact that this winter's temperatures have been far above the long-term average. In fact, although we reached a low of 10F (well below the mean temperature for the night of Jan 29/Jan 30), the trend for most the entire previous week was that of above-average daytime and nighttime temperatures (and 20 of the previous 30 days in January have been above average, too, and today through February 4 is supposed to be not only above average - which is a daytime high temp of 28F - but above freezing, too).
This has meant many things for the forest, but it has meant a very critical thing for Third Sister Lake: the ice cover this year remains un-set: a small open pool remains toward the center of the lake, filling in only when temperatures stay below freezing, but opening again once the snows melt (and the rain falls). It is with this reality in mind that I was interested to read this story from Greg Laden's Blog titled, "Global Warming is Ruining Minnesota Winter".
In the post, Greg points out a few things about Minnesotan lakes that appear to generally hold true for Third Sister Lake as well:
While we cannot definitively say that the 2010-2011 winter's snowfall was caused by global warming, scientists do recognize that, under conditions of global warming, greater amounts of snowfall is expected in regions where snowfall is possible, such as the upper Midwest. (For an explanation as to why, check out this article from Feb 2010.)
This has meant many things for the forest, but it has meant a very critical thing for Third Sister Lake: the ice cover this year remains un-set: a small open pool remains toward the center of the lake, filling in only when temperatures stay below freezing, but opening again once the snows melt (and the rain falls). It is with this reality in mind that I was interested to read this story from Greg Laden's Blog titled, "Global Warming is Ruining Minnesota Winter".
In the post, Greg points out a few things about Minnesotan lakes that appear to generally hold true for Third Sister Lake as well:
Since the water is cold at the time of freezing, there is more oxygen in some of the lakes than there might otherwise be. Since some of the lake surface is covered with ice but not a thick layer of snow, sunlight gets into the lakes during the winter promoting photosynthesis in the algae living beneath the ice, which enhances oxygen supply. The occasional break-through of ice during the winter, if there is a warm up and sufficient wind, adds additional oxygen.Third Sister Lake has seen similar trends over the past couple of years, being able to literally support some illegal ice-fishing on the lake. Last year's ice sheet was quite thick and stayed set up well into March (and the ice didn't go away until April). However, there was also a lot of snow; the 8th most snow recorded in Ann Arbor. In some Minnesotan lakes, high levels of snow actually led to fish die-offs:
Meanwhile, if the ice gets thick fast and stays thick, fishermen and women can ice fish early, often, and well into the season. Many Minnesota lakes sport regular fish contests and festival's during the winter that depend on this thick ice.
In recent years, there have been some changes owing to global warming. In a warmer world, there will be some years (but certainly not all) where Minnesota experiences much more snow than it used to. This happened last year. Some lakes had so much snow on them last year that the algal activity was stifled and there was less oxygen in the water, and so those lakes experienced large die-offs of fish. Die-offs happen every year in some lakes, but it seems that the extra snow may have caused more fish to die than usual.Luckily for the bass and bluegill, this didn't happen in Third Sister Lake, despite the additional snow in the region (although a die-off of Gizzard Shad did occur elsewhere in Southeast Michigan). This could have been due to the existence of groundwater seeps into Third Sister Lake, but this is merely conjecture on my part.
While we cannot definitively say that the 2010-2011 winter's snowfall was caused by global warming, scientists do recognize that, under conditions of global warming, greater amounts of snowfall is expected in regions where snowfall is possible, such as the upper Midwest. (For an explanation as to why, check out this article from Feb 2010.)
In warmer years, such as we are experiencing this winter (and in many previous winters) the lack of thick ice has caused numerous accidents and even fatalities as Minnesotans wandering around on insufficiently frozen lakes, falling in now and then. This, to me, is the ultimate form of Global Warming Denialism. One ignores through ignorance, or willful ignorance, the obvious change in our climate and as a result dies. The number of people falling through ice and drowning in Minnesota seems to be on the rise (though even with increased numbers, the quantities are small enough that a statistical test may be impossible). An excellent indicator of the increased dangers of ice with global warming can be found in what is happening with fishing contests. Contests on lakes in the central part of the state have been repeatedly canceled, and in the case of the Big Lake contests, permanently abandoned as an activity after being canceled several years in a row. In other words, global warming has caused Big Lake to no longer reliably freeze. It's simply a new reality.Third Sister Lake has not - yet - set up. There remains a small hole toward the center of the lake, which opens up when the weather climbs above freezing and especially when there is rainfall. It could cause problems not only for the illegal ice-fishers, but also for the ecology classes that come out in February.
Playing for Change - Love the mission, love the videos
A little while ago, I learned about Playing for Change. This group, this mission, this music is truly internationally bound, uplifting, and moving. The mission of the PfC Foundation is "to connecting the world through music by providing resources to musicians and their communities around the world." The foundation does some great filming and mixing of musicians from around the world - to play "together" in completely new versions of well-known pieces of music.
These are some of my favorites (with their own video descriptions, when relevant):
La Tierra Del Olvido
Higher Ground
One Love
Groove in G
I really love the international complementarity, cohesion, and channeling that these artists are doing; grooving with each over to completely extemporaneously derived and layered music that started with only a requirement of a key.
Imagine
Chanda Mama
Don't Worry
and finally, my favorite song Stand by Me
If you like this foundation - the music or the mission - then check out their page (playingforchange.com) or their YouTube channel.
These are some of my favorites (with their own video descriptions, when relevant):
La Tierra Del Olvido
This video features over 75 musicians across the country of Colombia. Throughout our journey we have learned that music is the greatest tool for healing broken countries, cultures and hearts. With this video we set our to unite and inspire the people of Colombia so they can move forward from years of conflict and create a positive future.
Higher Ground
One Love
Groove in G
I really love the international complementarity, cohesion, and channeling that these artists are doing; grooving with each over to completely extemporaneously derived and layered music that started with only a requirement of a key.
We started this track in West Africa with a musical group named Tinariwen. We asked them to play a groove in the key of G, then as we traveled the world we added more musicians to the song. Over the course of our travels it transformed into a global jam with its roots in the blues.
Imagine
In the beginning of 2010 the Playing For Change crew began work on a new Song Around the World, John Lennon's "Imagine." It has been an amazing year of production, taking the crew from the favelas of Brazil to the shrines of southern India, from villages in Nepal to the glittering urban landscape of Tokyo and New York, and beyond.
This song is the Playing For Change Foundation's gift to the world. The Playing For Change Foundation feels honored to have the blessing and generous support of Yoko Ono as music lovers around the world join together to launch the Power to the People campaign. The campaign seeks to advance John Lennon's vision of peace by engaging artists and audiences to contribute to music education programs worldwide. Proceeds raised will help build music schools, support teachers and music programs, purchase instruments, and connect schools for cross-cultural learning and conflict resolution across borders. Music IS the power: Power to the People.
Chanda Mama
This Song Around The World is a folk tune from Chennai, India. We started the track in New Orleans and added musicians from the across the globe before finally delivering it the people of its origin. We ended up in Chennai recording and filming the vocals from the Oneness Choir. The track has a feeling of perseverance and joy and features vocalists from four continents.
Don't Worry
From the award-winning documentary, "Playing For Change: Peace Through Music", comes an incredible track written by Pierre Minetti performed by musicians around the world adding their part to the song as it traveled the globe. "Don't Worry" is the follow up to the classic "Stand By Me" and the second of many "songs around the world" released on the "Songs Around The World" CD/DVD in stores now everywhere.\
and finally, my favorite song Stand by Me
If you like this foundation - the music or the mission - then check out their page (playingforchange.com) or their YouTube channel.
Sunday, January 29, 2012
Songs that make me cry (or at least start to tear up)
Sometimes, when I listen to songs from the deep depths of my childhood, tears start to come. These aren't moving arias. These aren't symphonic miracles. These don't have mind-blowing powerchords. These are - I must admit - almost all folk songs. Many of them written generations ago and now seem to be almost nothing more than distant memory for an aging generation. However, perhaps because I was the very youngest of all my cousins - born 12 years after my youngest cousin on my father's side and 6 years after my youngest cousin on my mother's side (but about 25 years after my oldest cousins on both sides) - I have inherited an "old ear". I certainly wasn't surrounded by classmates who sang these songs (so I have only my parents to "blame").
Too, due to my mixed heritage, these songs are both Japanese folk songs as well as American folk songs. It is, unfortunately, sometimes difficult to find songs that move me so much partly because I don't remember all the folk songs of my childhood. However, these are a few that tug greatly on my heartstrings:
"Aka tombou"
... and a different singing of it by the same artist (sung for Cyndi Lauper):
The second one really do cut right to the quick. The haunting aspect to the timbre really connects with something very deep-seated in me. Also, the style of singing is just so foreign in this world of pop hits and heavy rhythms. It all harkens back to a time that I never knew, but could imagine with as much longing as the words of the song - and the voices of the singers - convey.
I know that there are other Japanese folk songs that would evoke a similar reaction. However, these fall (unfortunately) in the category of not being able to remember the names of the songs that I heard when I was so very young. Perhaps, on a cassette somewhere in a box somewhere in my parents' home that has similar songs. However, I also remember growing up with this - somewhat famous even in the US - song:
"Ue wo muite arukou" (上を向いて歩こう) a.k.a. "Sukiyaki Song"
This one, though, only makes me sad when I start to sing along... However - moving over to US folk songs - this one is like "Aka tombou" above, jerking tears from my eyes with little problem:
"My Grandfather's Clock"
I also really get moved by "Old Man River". Especially Lawrence Beamen's 2009 audition version for America's Got Talent
Thanks to the cassette tapes that my parents had when I was growing up, I also got to learn the songs of Harry Belafonte. And while I like the songs that perhaps most people know - "Banana Boat Song," and "Jump in the Line" - one of the songs that I heard was "Island in the Sun":
It spoke to me - a child who was born on Guam (an island in the sun) who moved away from it so young. The feelings that would fill me every time that I listened to this song when I was in adolescence - when we were visiting Guam on occasion - I would have fleeting memories of the warm sun, the gritty sand, and the sounds of the waves and it taught me very early about the word "nostalgia."
Another one of Harry Belafonte's songs from that cassette tape of my parents' was "Cu Cu Ru Cu Cu Paloma":
I didn't even know the meaning of the words, and it wasn't until I listened to it recently - after I learned a decent amount of Spanish - that I could understand the lyrics. Still, the emotion poured into the words... moved me even as a child.
And my mom really liked the songs of John Denver, too. I must have listened to all the songs - famous and obscure - that he released during his career. One of my favorites - perhaps what piqued my interest in biology and science - was "Calypso"
True, "Rocky Mountain High" also lifts me (yeah, yeah), but nothing like this song. Strange, though, that it wasn't until MUCH later that I learned that the song was an homage to Jacques Cousteau and the name of his boat: Calypso. (Hell, I ended up going into marine biology at St. Andrews without ever having - knowingly - seen anything from Jacques Cousteau, heresy though that may seem.)
Then there are some songs that are - to me - just haunting in their rendition:
"Skye Boat Song"
and "Pokarekare Ana"
Okay, okay, I grew to like some Scottish folk songs - Scotland the Brave, Flower o' Scotland, Loch Lomond, etc. - a nod to the time that I spent in Scotland. (And a late toast to Burns Night, just 4 nights ago.) However, they weren't songs that I heard when I was growing up, so I won't include them here (also because this list is getting rather lengthy).
Therefore, I'll end with one more; a song that doesn't really fit in with the above. It's not "haunting"; it's not Japanese nor is it American; it's not from any single singer that my parents listened to. However, it's stuck in my mind as one of the songs of my childhood; one that can - at times - make me start to tear up a little bit: "Cielito Lindo":
Although this one was made by the Banamex bank, I really like its multi-regionality. It's strange that I remember hearing this song growing up, since it is one of the very few Mexican songs that my mother actually knew and had (and liked). Again, like "Cu Cu Ru Cu Cu Paloma," I had no idea of the meaning of the words before I listened to it again after learning Spanish.
Okay... I've got to stop now. It's getting too emotional for me. So, here's one to lighten the mood and go in completely the other direction:
"Birdhouse in your soul"
(Thanks to my brother to introducing me to this song.)
Saturday, January 28, 2012
Amazing NASA image of the Earth
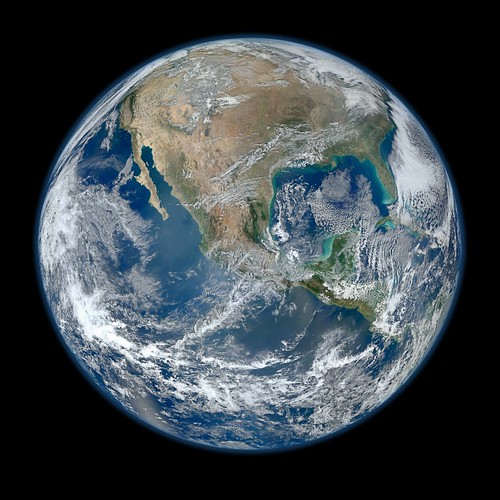
The above image is also available at 8000x8000 resolution. Pretty awesome! Also, there is an "expanded" version of Earth:

NASA Goddard has more photos of Earth on its Flickr page, too.
Friday, January 27, 2012
The problem with intelligence in science fiction
As a closing question in an interview with Tim Maudlin, there was this question (and response):
I recently came across a paper about Fermi's Paradox and Self-Replicating Probes, and while it had kind of a science fiction tone to it, it occurred to me as I was reading it that philosophers might be uniquely suited to speculating about, or at least evaluating the probabilistic arguments for the existence of life elsewhere in the universe. Do you expect philosophers of cosmology to enter into those debates, or will the discipline confine itself to issues that emerge directly from physics?
Maudlin: This is really a physical question. If you think of life, of intelligent life, it is, among other things, a physical phenomenon -- it occurs when the physical conditions are right. And so the question of how likely it is that life will emerge, and how frequently it will emerge, does connect up to physics, and does connect up to cosmology, because when you're asking how likely it is thatsomewhere there's life, you're talking about the broad scope of the physical universe. And philosophers do tend to be pretty well schooled in certain kinds of probabilistic analysis, and so it may come up. I wouldn't rule it in or rule it out.
I will make one comment about these kinds of arguments which seems to me to somehow have eluded everyone. When people make these probabilistic equations, like the Drake Equation, which you're familiar with -- they introduce variables for the frequency of earth-like planets, for the evolution of life on those planets, and so on. The question remains as to how often, after life evolves, you'll have intelligent life capable of making technology. What people haven't seemed to notice is that on earth, of all the billions of species that have evolved, only one has developed intelligence to the level of producing technology. Which means that kind of intelligence is really not very useful. It's not actually, in the general case, of much evolutionary value. We tend to think, because we love to think of ourselves, human beings, as the top of the evolutionary ladder, that the intelligence we have, that makes us human beings, is the thing that all of evolution is striving toward. But what we know is that that's not true. Obviously it doesn't matter that much if you're a beetle, that you be really smart. If it were, evolution would have produced much more intelligent beetles. We have no empirical data to suggest that there's a high probability that evolution on another planet would lead to technological intelligence. There is just too much we don't know.
Thursday, January 26, 2012
Cultural calendars and global warming
From PhysOrg comes a news blurb about mapping climatic changes to the Chinese "cultural calendar" of the 24 solar terms. According to Wikipedia's entry (because the description on the PhysOrg blurb wasn't too enlightening) on solar terms:
However, the climate has not remained stable, and in an interesting combination of combining a cultural calendar with climatic measurements, a new paper has been published that shows how - in China - the 24 solar terms have changed in character. First, though, the researchers had to convert solar periods into correlative temperature ranges (in order to make the climate change comparisons). That done, this is what they found:
One reason why I find this so interesting is that this is the sort of thing that represents an important step in disseminating information about climate change to the public, using cultural vehicles that they know, understand, and are familiar with. Too often, a lot of the cutting-edge science and its critical findings are written in a way that requires a mess of cultural decoding. Often, too, it takes the implicit assumption of the Western world: marking (in this case) the calendar into the 12 months (which - themselves - were rather arbitrarily set way back when) that are commonly used in the West, but may rarely be used so intuitively outside of cities in the rest of the world. Although this article refers to China, the 24 solar terms are used throughout East Asia, and they still mark major celebration points in the Japanese calendar. In other words, this paper's findings speaks in the calendar language that is understood by upwards of 1.6 billion people (i.e., the combined population of China, Taiwan, North and South Korea, Japan, and Vietnam).
The paper, "Climatic changes in the Twenty-four Solar Terms during 1960–2008", can be found here: http://www.springerlink.com/content/g0264r7102x18844/
A solar term is any of 24 points in traditional East Asian lunisolar calendars that matches a particular astronomical event or signifies some natural phenomenon. The points are spaced 15° apart along the ecliptic and are used by lunisolar calendars to stay synchronized with the seasons....These solar terms have been given names of what is expected to occur during that period (e.g.,"awakening of insects", usually beginning around March 5 or "major heat", usually beginning around July 23). As such, these names serve a social use as well - mainly to provide agricultural cues. Provided that the climate remains stable, these cues - barring annual variations - provide a useful "farmer's almanac." Indeed, given the assumptions of the use over 2000 years in China, the 24 solar terms likely became divorced from the actual position of the sun and became more of a description of the expected climatic conditions at certain periods throughout the year.
Because the Sun's speed along the ecliptic varies depending on the Earth-Sun distance, the number of days that it takes the Sun to travel between each pair of solar terms varies slightly throughout the year. Each solar term is divided into three pentads (候 hou). Each pentad consists of five days (rarely six), so there are 72 pentads in a year.
However, the climate has not remained stable, and in an interesting combination of combining a cultural calendar with climatic measurements, a new paper has been published that shows how - in China - the 24 solar terms have changed in character. First, though, the researchers had to convert solar periods into correlative temperature ranges (in order to make the climate change comparisons). That done, this is what they found:
According to these results, the timings of the climatic Solar Terms during the warming phase (around spring) of the seasonal cycle have significantly advanced (by 6-15 days) from the 1960s to the present.
Across China, timings during the cooling phase (around autumn) have delayed by 5-6 days on average. This is mainly because of a warming shift of the entire seasonal temperature cycle, as illustrated in the figure. Four particular phenology-related climatic Solar Terms, namely the Waking of Insects, Pure Brightness, Grain Full, and Grain in Ear, have advanced almost everywhere in the country (as much as 20 days in North China). This has important implications for agricultural planning. The numbers of extremely cold (Great Cold) days decreased by 56.8% over the last 10 years as compared with the 1960s, whereas those of extremely hot (Great Heat) days increased by 81.4%.
 |
| Graph from Qian et al (2012). Caption from the paper reads: "Climatological mean ALCs (seasonal cycles) of the China mean temperature for the earliest 10 years (blue line) and for the latest 10 years (red line). Dashed lines indicate the temperature thresholds for the 24 Solar Terms" |
One reason why I find this so interesting is that this is the sort of thing that represents an important step in disseminating information about climate change to the public, using cultural vehicles that they know, understand, and are familiar with. Too often, a lot of the cutting-edge science and its critical findings are written in a way that requires a mess of cultural decoding. Often, too, it takes the implicit assumption of the Western world: marking (in this case) the calendar into the 12 months (which - themselves - were rather arbitrarily set way back when) that are commonly used in the West, but may rarely be used so intuitively outside of cities in the rest of the world. Although this article refers to China, the 24 solar terms are used throughout East Asia, and they still mark major celebration points in the Japanese calendar. In other words, this paper's findings speaks in the calendar language that is understood by upwards of 1.6 billion people (i.e., the combined population of China, Taiwan, North and South Korea, Japan, and Vietnam).
The paper, "Climatic changes in the Twenty-four Solar Terms during 1960–2008", can be found here: http://www.springerlink.com/content/g0264r7102x18844/
Wednesday, January 25, 2012
How to improve air quality (Beijing style)
Although Beijing has started to release its fine-particulate (PM2.5) data, there is an additional point of concern: Beijing's current classification system currently classifies "light pollution" at the same level as the US classification for "hazardous."
This raises a point of concern about grading scales. If two groups are using two different scales to measure the same thing, then it is not likely that the values will overlap. This is easily seen with many things that we might deal with in life: metric vs. US/British measures; shoe sizes; clothing sizes; etc. While I wear a size 11 (or 11.5) in the US, I wear a size 46 (or 48) in Europe. While I wear a shirt size of "Large" in the US, it changes to XXL or XXXL in Japan (I even have a XXXXXL vest that I bought in Japan that is only slightly too big for me). If we live between the two systems of measurement, then we understand how to convert (or estimate) the rough value of the "other" scale (at least in the range that we most often encounter it). Therefore, I know how to "feel out" the rough temperature equivalents between F and C in the range that I experience them (0F to 90F or -18C to 32C); I know how to feel out the rough conversion from kph to mph (especially good when I'm driving in much of the world, since driving is the only time when I encounter speeds above 50kph). So that's pretty clear; if you rarely encounter a different scale, then your proficiency of mental conversion is going to be slower and less accurate. Finally, I have often found that if I use a particular metric for a long time, then I am likely to start thinking in terms of that metric than in terms of converting from my "original" one. Therefore, after having lived outside the US for several years, I was mentally converting temperature readings from F to C so that the number would make sense to me. Now, however, I don't really need to do the mental conversion; the value of the F reading makes sense in its self.
Well, that's all well-and-good, but what does this have to do with Chinese air pollution? Well... the values for temperature and shoe size don't come as subjectively named categories. We could, of course, convert air temperatures into a scale going from "blistering cold," to "searing hot". However, you and I would start to disagree on where the cut-offs should be. This is why I generally respond to question of, "is it cold outside," with, "Well, I don't think it's cold" (or, "it might be a little cold for you," if I happen to know or can guess at the other person's preference).
China's air pollution standard (at least how it currently stands) uses a different classification system than the US. It's analogous to your mother's definition of "cold" from your own.... except that it's a national standard. Of course, it's a national standard based on a measured number, but often - when it's something that a person is not really comfortable using the raw number - people will gravitate to the category bin label. This is one source of the problem, because the two scales are completely different. (I couldn't find a comparative chart between the US and Chinese PM2.5 scales, sorry.) The stated difference between the two scales is more like my stated range of "tepid" being analogous with another person's definition of "blistering cold." (I am reminded of a Costa Rican student who was experiencing her first semester of Michigan fall/winter weather: she came to class one early October day dressed in a full parka while most were wearing light jackets, and I showed up in shorts. If you had asked her if it was cold and asked me if it was cold, our answers would have been vastly different.) This wouldn't be such a problem if the measurements were merely stated perceptions of temperature, but they are actually more important than that: they are public health advisories.
Presumably, Beijing's classification system does go to "hazardous" and presumably the US scale does go to "light pollution" (or even "no measurable pollution"), but - even if they are using the same technique to measure PM2.5 in the air - it is clear that the cut-offs for the categories are very different. However, the credibility problem comes when people look at the measurement of "light pollution" vs. "hazardous" and recognize that what they are experiencing is much closer to what the other government is telling you. ...and China knows this. China also knows that the people - no matter how used to smog they may have become - know that the air is polluted and the water is polluted, regardless of what category name the use. Okay, so Beijing calls it "light pollution"; the meaning of "light pollution" will therefore mean something equivalent to, "shitty air." In isolation, having such a category name wouldn't mean very much to credibility, since people will merely do the conversion in their head (much like converting shirt sizes, mentioned above). However, when that categorization scheme is placed next to another one that makes more sense, then people are likely to start distrusting the one that makes less sense.
Therefore, yes, Beijing can say that it's air pollution levels are "light" or even "moderate". It can meet whatever environmental or public health policy goals by meeting the requirements of having a certain number of days that are classified as having "light" air pollution, but the reality is that if the definition of "light" pollution is, in actuality orders of magnitude above unpolluted conditions, then the only thing that you're fooling is the documentation; the only thing that you're fooling is the propaganda; the only thing that you're fooling is the official rhetoric... and those who believe. Do that in isolation and you might well get away with it (witness the mental dissonance that went on during the Cultural Revolution), but do that while a rival government gives away information that better matches what people experience, and you've got a serious credibility problem on your hands.
If you remember, this is what was popularly stated that George W. Bush's "Clear Skies Initiative" would have done: moved the goal posts on metrics of acceptability such that we could have had "acceptable" conditions under "Clear Skies" that would have been described as some level of "unacceptable" under the existing framework.
In short: You can improve air quality from "bad" to "good" by using a scale that shows current quality as "good". Don't be surprised, though, when people don't believe you. Don't be surprised, either, when they believe another government's scale that matches up more closely with their perceptions.
Story from PhysOrg.
Tuesday, January 24, 2012
2011 was globally the 9th warmest year since 1880
Well, the numbers are in: according to NASA's Goddard Institute for Space Studies (GISS), 2011 was globally the 9th warmest year since 1880, and 9 of the 10 warmest years have happened since 2000, with temperatures +0.92F (+0.51C) higher than the mid-20th century, which is used as a baseline for comparison.
Oh, and remember that 2011 was supposed to be a La Nina year (and that La Nina years are supposed to be colder than other years)?
Oh, and remember that 2011 was supposed to be a La Nina year (and that La Nina years are supposed to be colder than other years)?
"We know the planet is absorbing more energy than it is emitting," said GISS director James E. Hansen. "So we are continuing to see a trend toward higher temperatures. Even with the cooling effects of a strong La Niña influence and low solar activity for the past several years, 2011 was one of the 10 warmest years on record."And still 2011 broke into the top 10. Next year - unless we have two La Nina years in a row - is likely to be warmer globally. And if we have an El Nino year?
Hansen said he expects record-breaking global average temperature in the next two to three years because solar activity is on the upswing and the next El Niño will increase tropical Pacific temperatures. The warmest years on record were 2005 and 2010, in a virtual tie
Yeesh.
"It's always dangerous to make predictions about El Niño, but it's safe to say we'll see one in the next three years," Hansen said. "It won't take a very strong El Niño to push temperatures above 2010."
Monday, January 23, 2012
Hello...?
Several months ago, I saw this rather humorous sign:

Very cute (but unfortunately without attribution). I saw this other tribute to Lionel Richie's song:
Hello from ant1mat3rie on Vimeo.
For those of you who are not familiar with the song, here is the original (with lyrics):

Very cute (but unfortunately without attribution). I saw this other tribute to Lionel Richie's song:
Hello from ant1mat3rie on Vimeo.
For those of you who are not familiar with the song, here is the original (with lyrics):
Sunday, January 22, 2012
Hostess on the Nutrition Grade: An exercise in linguistic obfuscation?
I was curious about the amount of calories in a Hostess Twinkie. Turns out that it's 150 calories per Twinkie - which is a lot of calories, but how does it break down?
However, look at how the description of nutrition grade continues:
On the one hand, they are saying that, yes, you could eat only foods with a nutrition grade of A and still gain weight, and (probably since - as a mass producer of cheap sweets - Hostess' products aren't likely to get the A-grade) weight loss is effectively about calorie counting, but that weight loss isn't all about health. But then... if you're eating lots of Twinkies, then you're probably in a bad way anyway.
- Calories: 150
- Calories from fat: 41
- Total Fat: 4.5g (7%)
- Saturated Fat: 2.5g (13%)
- Trans Fat: 0.0g
- Cholesterol: 20mg (7%)
- Sodium: 220mg (9%)
- Total Carbohydrate: 27.0g (9%)
- Sugars: 18.0g
- Protein: 1.0g
- Vitamin A: 0%
- Vitamin C: 0%
- Calcium: 0%
- Iron: 2%
Woah... And that's all based on a 2000 calorie diet. A 2000 calorie diet - according to this calorie calculator - shows that - for a 34-year-old, 5'4", 164lb. female (the average American female's height and weight) is maintenance weight for those who engage in exercise 3 times per week. (Well... the maintenance caloric intake is actually 1967 calories, and not 2000 calories.) For this woman to be be in the "fat loss" category with ~2000 calories/day, she would need to do intense exercise every day or (not-intense) exercise twice per day (1974 calories/day). This is a lot of physical activity to engage in for one Twinkie to be relatively insignificant.
For a 34-year-old, 5'9", 191lb. male (the average American male), his maintenance caloric intake with little or no exercise is 1959 calories (41 calories less than the 2000 calorie diet); at 3 exercise times/week means a maintenance caloric intake of 2245 calories per day. In order for this male to be in the "fat loss" category with ~2000 calories/day, he would need to do intense exercise five times per week (2024 calories/day). Although not as much as for the average female, it is still a significant amount of activity to engage in for that Twinkie to be relatively insignificant.
In other words, it's not surprising that the Twinkie is given a Nutrition Grade of "F". I had never heard of a "Nutrition Grade", but here is what Hostess says on its page:
The Nutrition Grade was developed with the goal of helping people improve the nutritional quality of their diets. This tool is fully automated and does not feature any manual corrections - hence all items are evaluated objectively and following the same set of rules.Wow, look at that language: it scores a lot of the big points in terms of power words: "fully automated", "objective", "same set of rules", and "algorithm". These terms make everything sound really fair and scientific and wonderful for those ways - in that SCIENCE is a thing to help you out.
As you may know, not all nutrients are equally good for you. Some of them, like cholesterol, sodium, and saturated fats should be avoided as much as possible. Some other ones, however, such as minerals and vitamins, are essential for your health. Thankfully, the USDA devised the Recommended Daily Allowance (RDA) figures for each one of these nutrients, which were used as the foundation of the Nutrition Grade's algorithm.
Obviously, foods rich in minerals and vitamins are graded highly, and their good points are all listed right next to their grade. Undesirable nutrients contribute to the bad points. Even though the USDA does provide RDA values for these nutrients, these values must be understood differently from those for the desirable nutrients; the undesirable RDAs should be viewed as the very last limit, whereas the desirable RDAs mark a target to shoot for.
The Good and the Bad Points provide a summary of what the Nutrition Grade identifies as the food items' special strengths and weaknesses. Those points are then converted to a numerical format, and then finally turned into the well-known letter format (A-best; F-worst).
However, look at how the description of nutrition grade continues:
No automated tool is perfect, and the same is true for this one. Please understand that Nutrition Grade only checks how close or far away a certain food is in respect to your RDAs. There are many more aspects that need to be considered for Health, and this is only one of them.Wow, after saying all of those good things about how "objective" it is calculated, how "fully automated" it is, using the "same set of rules" in its "algorithm", Hostess' page is now pointing out that all of these points - which were (arguably) given in a good light in the opening paragraphs, are now described with their negative qualities. It's interesting to see how the language is now changing into the, "Yes, but..." framing. But it gets better in the final paragraph:
Finally, Nutrition Grade will not necessarily help you lose weight. It will, hopefully, help you get it done as healthy as possible, but you could, for example, eat only perfectly graded food items and still end up gaining weight. Weight loss is all about counting calories and it is not necessarily related to health - but health and weight loss are also not mutually exclusive. In other words, you should keep an eye on your calories, and at the same time, also try to get as good a grade as you can.Wow, talk about equivocation! Let's interpret the words here:
Finally, Nutrition Grade will not necessarily help you lose weight. It will, hopefully, help you get it done as healthily as possible, but - as a company that produces cheap sweet snacks that aren't going to help you lose weight we are going to tell you that - you could still end up gaining weight - especially if you eat grade-A foods to excess. Weight loss is all about counting calories and it is not necessarily related to health - even though we just tried to put a sliver of doubt into your mind my pointing out that it is possible to eat healthy foods and still not lose weight - but health and weight loss are also not mutually exclusive. (Hopefully, that was overly obfuscatory.) In other words, you should keep an eye on your calories, and at the same time, also try to get as good a grade as you can (so: eat our products, but also eat some fruit).Talk about an interesting use of language to try and put a shine on the low-nutritional quality products that this company produces without actually saying anything untrue nor saying things in such an abstruse manner that it's incomprehensible.
On the one hand, they are saying that, yes, you could eat only foods with a nutrition grade of A and still gain weight, and (probably since - as a mass producer of cheap sweets - Hostess' products aren't likely to get the A-grade) weight loss is effectively about calorie counting, but that weight loss isn't all about health. But then... if you're eating lots of Twinkies, then you're probably in a bad way anyway.
Saturday, January 21, 2012
Just what religion are they?
The latest YouGov poll
has some interesting things about the viewpoints of potential voters
about the candidates (from the GOP as well as about the President).
Interesting thing about that poll's results (go to page 25 of the
report): 30+ year-old, White, women with high school or less education,
from the Midwest or South, and with a family income of less than $40k/yr
are the most likely to believe that President Obama is a Muslim.
(Independently, each of these groups scored 20% or 21%, which was the
highest percentage of these categories.) However, being a conservative
or a Republican were the greatest indicators of whether you were so
massively misinformed on this pretty straightforward topic, with 32% and
35%, respectively, believing he is a Muslim.
Interestingly, only 50% of all responses pegged him as a Christian, which is about as good as flipping a coin with the options being "Christian" and "not a Christian".
Let's compare the answers of the religion question with Romney and Santorum (both ostensibly known or labeled due to their religion). For these non-national, not-presently-serving-in-government people, 65% of people correctly stated Romney as a Mormon and 28% not knowing, whereas only 24% identified Santorum as Catholic (although if you add "Christian" and "Catholic" together, you get 52%) with 47% not knowing.
It's not surprising: much of what most people supposedly knew of Mitt Romney's identity was that he was a Mormon (as well as the former governor of Massachusetts). Indeed, almost no one misidentified him as being Christian (only 4%), Jewish (0%), Muslim (1%), or Catholic (3%), which meant that the remaining were likely mostly inclusive of people who didn't really care about religion as a part of identity. It think - based upon the robustness of the media reports about Romney's Mormon religion - this number (28%) would indicate a baseline percentage against which to compare Obama's own "don't know" of 28%.
Of Santorum: I think that a lot of people were not so knowledgeable, although most could presumably have guessed that he wasn't Jewish (only 1%) or Muslim (0%). Too, most people could have guessed that he wasn't Mormon (indeed only 1%). That left people with the options of Christian, Catholic, or don't know (or Christian/Not Christian). The relatively high "don't know" value of Santorum - 47% - is an interesting commentary, since it may indicate (and it does indicate to me) an inability to correctly determine whether Santorum is Catholic (and thus answer "Catholic") or another type of Christian (and thus answer "Christian"). I think - in the end - that having "Christian" and "Catholic" as the two choices may have actually increased the "don't know" responses for Santorum. If the poll were to have, instead, included only an option for "Christian", then I think that the "don't know" responses would have been much lower. (As an aside, if the options were "Catholic" or "Protestant", I think that the responses would not have been too different, with "Protestant" taking the lion's share of the "Christian" responses.)
Why does all this matter? Well, as for the importance of a president's religiosity, as long as it doesn't affect the governing of the country, I don't really care that much. However, as a metric for how people (and which people) just plain get it wrong about a simple fact about what a person's religion is - that is important. Furthermore, there weren't such patterns of significant differences in response rates as can be seen in the responses for Obama. It means - to me - that there is a segment of the population that is being misinformed and allowed to remain misinformed of a simple fact of what the president is that one must wonder about their viewpoints about any other issues about the identity of the President (and, therefore, their perception about the legitimacy of the President.)
Friday, January 20, 2012
Testing out Japanese drinks
Matt Alt and others (aka: Néojaponisme) try out some "third category beer":
The men continue with highballs:
Who'd've thunk it? I'd like to try and make a video cast for Michigan beers... but maybe there are already some people who did that. (And plus, I think that I really like most of the MI beers that I've tried, much unlike the tone of these vids seem to me.)
The men continue with highballs:
Who'd've thunk it? I'd like to try and make a video cast for Michigan beers... but maybe there are already some people who did that. (And plus, I think that I really like most of the MI beers that I've tried, much unlike the tone of these vids seem to me.)
Thursday, January 19, 2012
Women doing (sexualized?) yoga: insulting or not?
I normally wouldn't watch this ad ...
... and go, "OMG, that is SO sexualizing yoga!" I wouldn't say that partially because I wouldn't actually use those words, but also because I watched it and didn't see it as sexualizing. Tiring, yes. Acrobatically proficient, yes. Beautiful to watch, yes. Sexualizing, no.
And yet, some do. From The Dish:
Is it objectifying perhaps, but sexualized? I didn't see it. However, perhaps this is something that offends a goodly amount of people who do yoga in the United States. Perhaps, too, it offends, people who do yoga in India.
Perhaps, too, it might fall ire to the lawsuit that is going on in India presently; the one trying to limit what's going on Facebook and Google's content? (Perhaps, too, the idea that a female American is making the above criticism of a sublime practice of meditation - chiefly among Indian males - will make such voicings themselves insulting to some...)
What I'm getting at is that - if the Indian court case ends up siding against Google and Facebook - the Internet is going to get even more loud, or lose all its subcontinent voices.
... and go, "OMG, that is SO sexualizing yoga!" I wouldn't say that partially because I wouldn't actually use those words, but also because I watched it and didn't see it as sexualizing. Tiring, yes. Acrobatically proficient, yes. Beautiful to watch, yes. Sexualizing, no.
And yet, some do. From The Dish:
Yoga advertising has been trying for a while now to make me feel bad about my body so that I get insecure enough to buy whatever they are selling. This is the number one MO of teen and adult women’s magazines (and men’s magazines for that matter): subtly hit the reader in an insecure place so that they buy more of this magazine and its products....... yeah... I'm not getting that message. If I did, then almost photo of a woman is sexualized, every sonnet about the shape of a woman's nape a veritable orgy of objectified sexualization, etc.
I think if I wasn’t a yogi or a woman or some combination of things that make me who I am, I’d see just the beauty of the video and move along. But the woman in the video is not only sexy, she is sexualized. This video exemplifies the male gaze: the sense that a woman is being watched, looked on as an object, (in pieces, at that: hip, thigh, butt, feet) from the heterosexual male perspective. Some feminists argue that even when women subject themselves to and desire this gaze, they are towing the line of the norms of a gender-unequal society (this is a big topic: see Laura Mulvey, “Visual Pleasure and Narrative Cinema“). This video pretends intimacy and innocence (just rolled out of bed for a 3.29 minute morning practice? Really?) but is carefully crafted: the lace underwear, the unmade bed, the closeups of hair coming loose and quick breathing, not to mention the butt shots in updog: it all says, subtly but very clearly, SEX. Heterosexual sex that puts the male gaze in a position of priority, and minimizes the female gaze (which some say can’t or doesn’t exist yet). And I’m not even going to touch on the money/class/yoga is only for rich people/peace is only for the superrich reading of this penthouse apartment. There is a difference between an erotic, sexy female body and a sexualized female body, especially when it’s being used to sell something.
Is it objectifying perhaps, but sexualized? I didn't see it. However, perhaps this is something that offends a goodly amount of people who do yoga in the United States. Perhaps, too, it offends, people who do yoga in India.
Perhaps, too, it might fall ire to the lawsuit that is going on in India presently; the one trying to limit what's going on Facebook and Google's content? (Perhaps, too, the idea that a female American is making the above criticism of a sublime practice of meditation - chiefly among Indian males - will make such voicings themselves insulting to some...)
What I'm getting at is that - if the Indian court case ends up siding against Google and Facebook - the Internet is going to get even more loud, or lose all its subcontinent voices.
Wednesday, January 18, 2012
Censorship on Wikipedia and Google
Today, if you go to the main page on Google.com, you will see this:

At the same time, if you go to any page on the English Wikipedia pages, you will see this:

Why the censorship Google banner and (English) Wikipedia black-out? Well, according to (English) Wikipedia's only working page (at least for today):
Wikipedia is protesting against SOPA and PIPA by blacking out the English Wikipedia for 24 hours, beginning at midnight January 18, Eastern Time. Readers who come to English Wikipedia during the blackout will not be able to read the encyclopedia. Instead, you will see messages intended to raise awareness about SOPA and PIPA, encouraging you to share your views with your representatives, and with each other on social media.And just what are SOPA and PIPA? (Other than innocuous-sounding pseudonyms?)
SOPA and PIPA represent two bills in the United States House of Representatives and the United States Senate respectively. SOPA is short for the "Stop Online Piracy Act," and PIPA is an acronym for the "Protect IP Act." ("IP" stands for "intellectual property.") In short, these bills are efforts to stop copyright infringement committed by foreign web sites, but, in our opinion, they do so in a way that actually infringes free expression while harming the Internet. Detailed information about these bills can be found in the Stop Online Piracy Act and PROTECT IP Act articles on Wikipedia, which are available during the blackout. GovTrack lets you follow both bills through the legislative process: SOPA on this page, and PIPA on this one. The EFF has summarized why these bills are simply unacceptable in a world that values an open, secure, and free Internet.So, why the blackout?
Why? SOPA and PIPA are badly drafted legislation that won't be effective at their stated goal (to stop copyright infringement), and will cause serious damage to the free and open Internet. They put the burden on website owners to police user-contributed material and call for the unnecessary blocking of entire sites. Small sites won't have sufficient resources to defend themselves. Big media companies may seek to cut off funding sources for their foreign competitors, even if copyright isn't being infringed. Foreign sites will be blacklisted, which means they won't show up in major search engines. And, SOPA and PIPA build a framework for future restrictions and suppression.You can still access (English) Wikipedia (check out the technical FAQ page), you can still do so. Otherwise, log in to Wikipedia in any other language that you can speak, because these pages aren't blacked out today. For example, the (Spanish) Wikipedia page looks like this:

This is why we should really like the Clean Air Act
Sometimes we forget about how much help the Clean Air Act is doing for our air in the US. Sometimes we might need a reminder, and Beijing has recently given us a demonstration as to why we want it. Via NASA:
Beijing without smog:
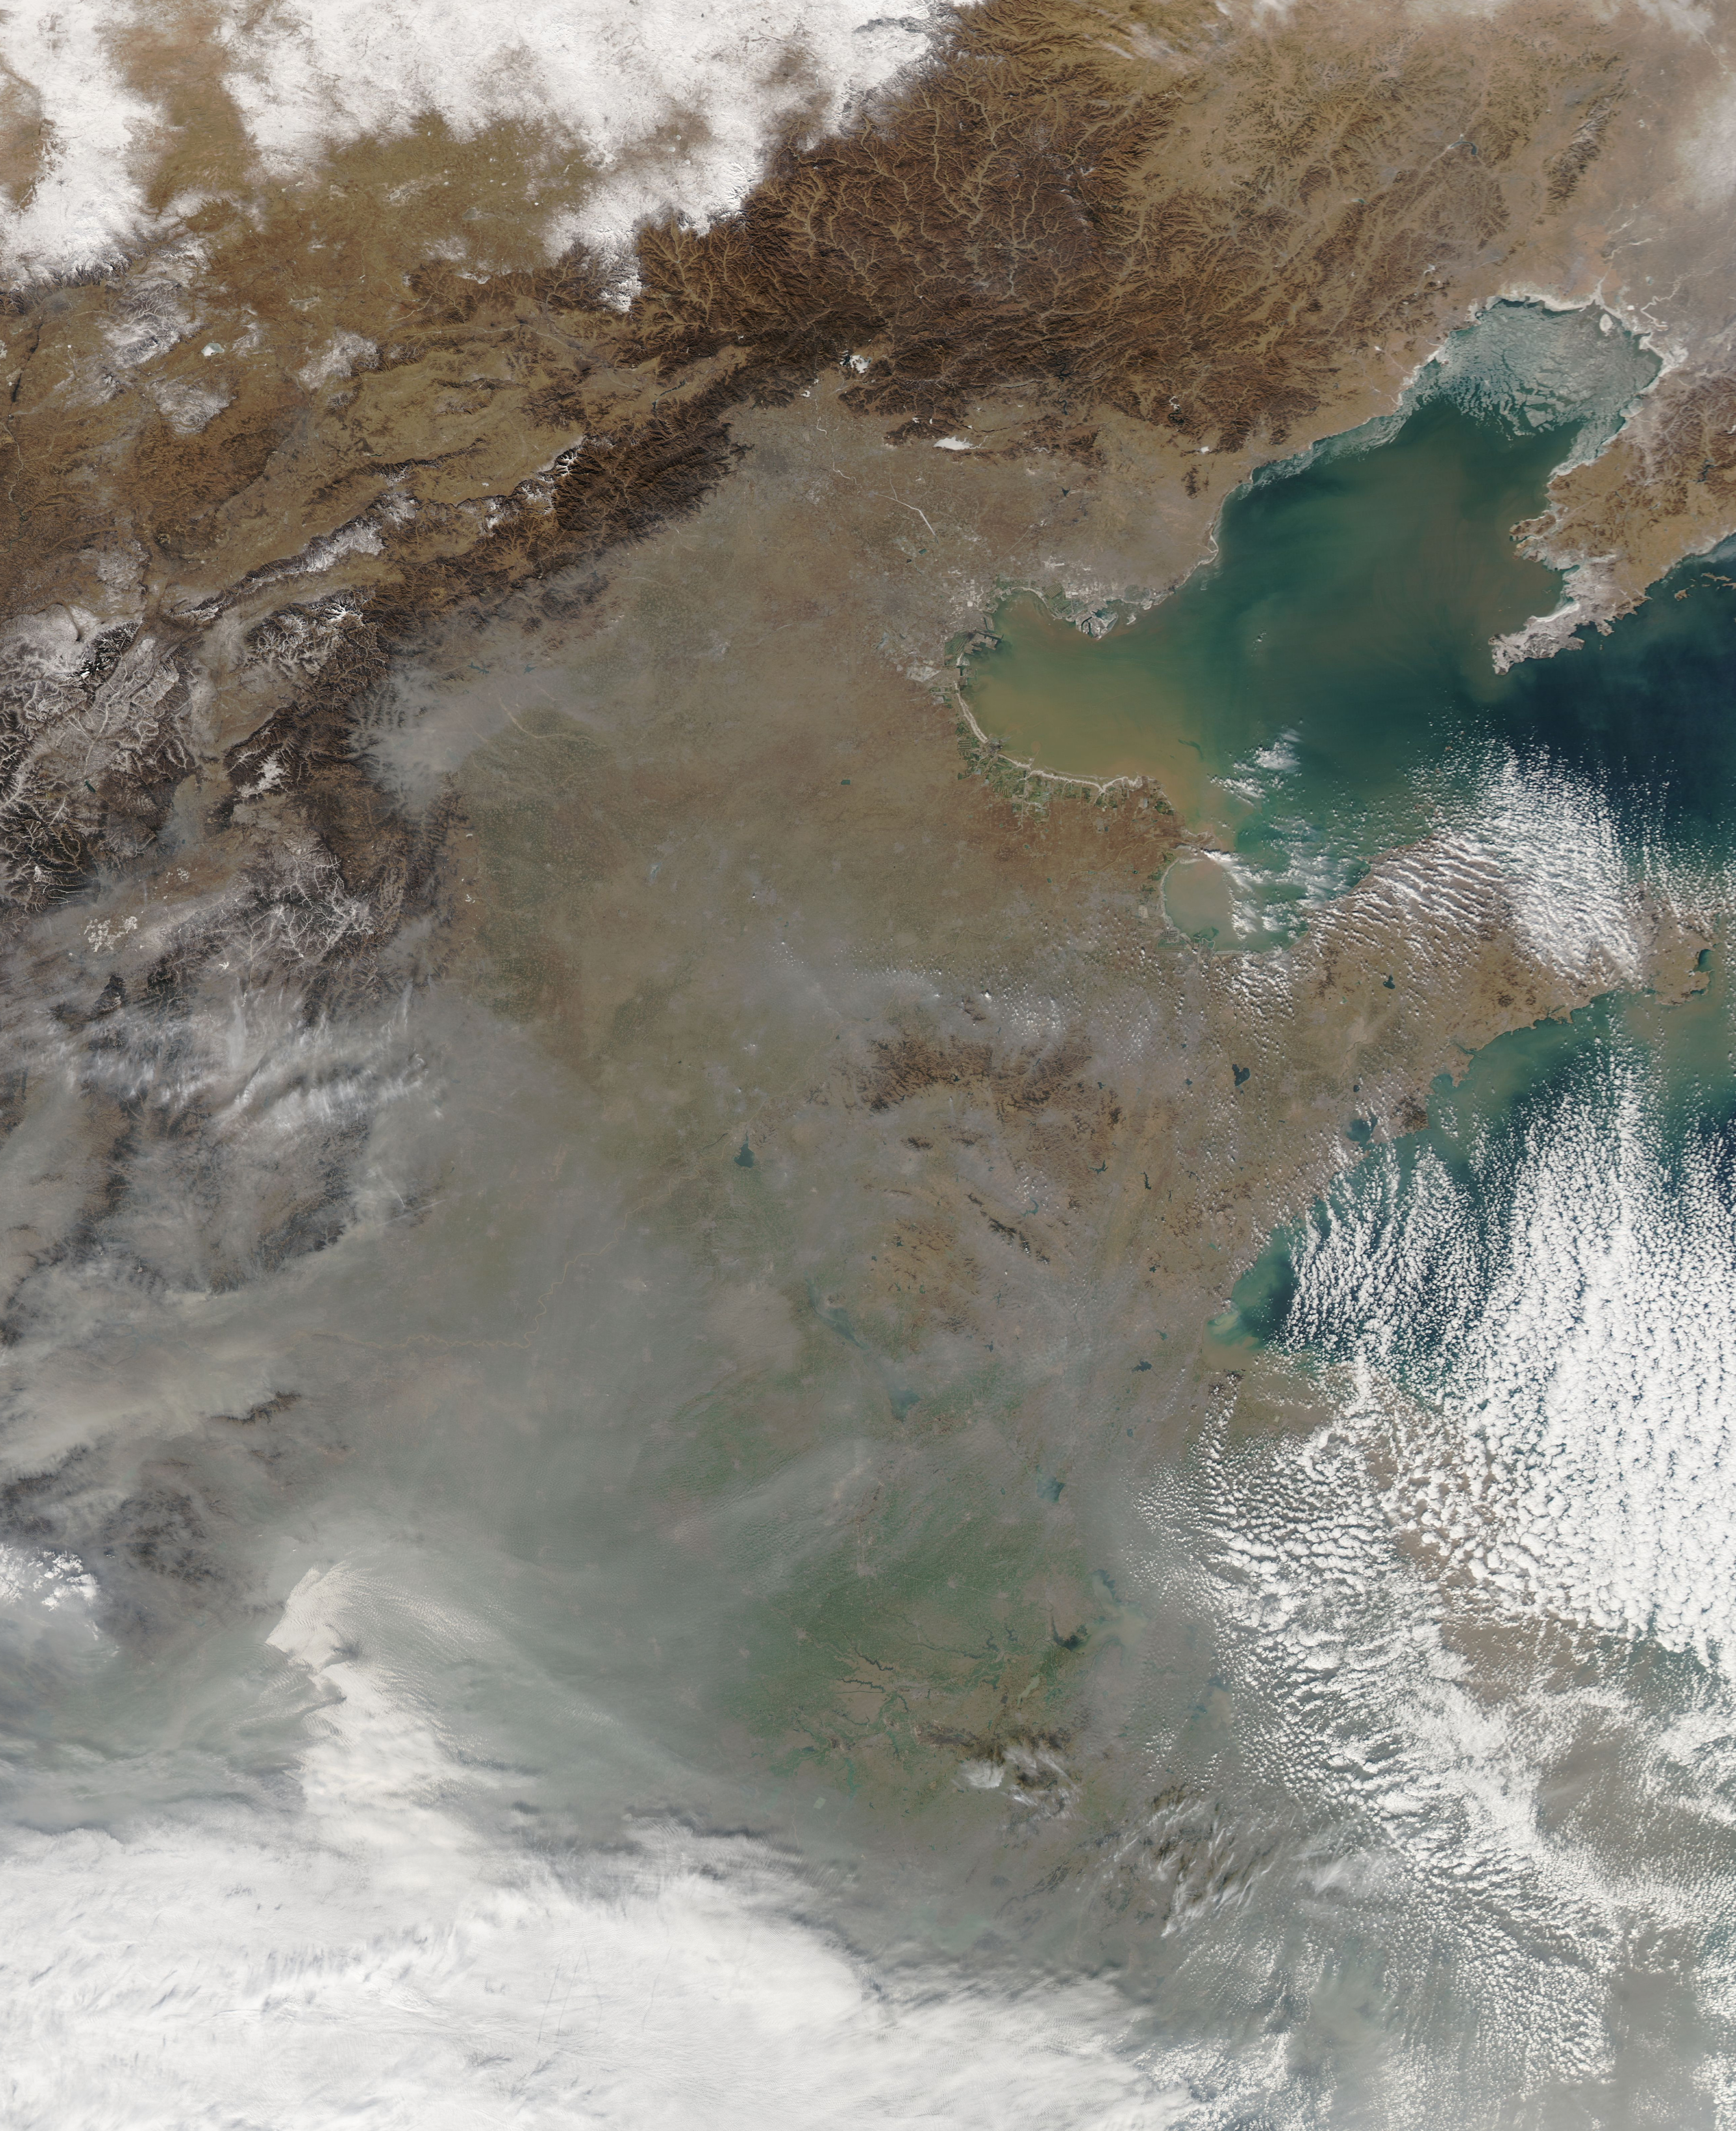
Beijing with smog:
 From the NASA website:
Beijing without smog:
Beijing with smog:
Fog and haze blanketed the North China Plain on January 10, 2012, making travel difficult. The Beijing airport cancelled 43 flights and delayed 80 more in the morning hours, when visibility dropped to 200 meters, according to state news reports. Provinces across the plain reported low visibility.UPDATE (2012-01-18): Via PhysOrg, Hong Kong air pollution currently kills (or is significantly related to deaths of) about 3000 people each year. Furthermore, their new clean air act plan "fails to impress."
The haze decreased visibility in satellite images too. A milky, gray pall entirely blocks the ground from view in the top image, taken in the early afternoon by the Moderate Resolution Imaging Spectroradiometer (MODIS) on the Aqua satellite. Patches of white fog or low cloud hang below the gray haze. Winds had already begun to push the haze out of Beijing in the north, but the rest of the North China Plain still suffered from poor air quality. By the next day, when Aqua MODIS acquired the lower image, skies were mostly clear across the region.
One major constituent of haze is particle pollution, such as dust, liquid drops, and soot from burning fuel or coal. Particles smaller than 10 micrometers (called PM 10) are small enough to enter the lungs, where they can cause respiratory problems. The density of PM10 reached 560 micrograms per cubic meter of air on January 10, said the Beijing Environment Protection Bureau. By contrast, U.S. cities exceed air quality standards when PM10 concentrations reach 150 micrograms per cubic meter.
But most of the pollution that makes up haze isn’t PM10; it’s finer particles, smaller than 2.5 micrometers in diameter (PM2.5). These particles can embed themselves deep in the lungs and occasionally enter the blood stream. The fine particles are highly reflective, sending sunlight back into space. The Chinese government does not currently measure PM2.5, but the U.S. Embassy in Beijing reports their measurements hourly in a Twitter feed. On the morning of January 10, PM2.5 measurements were off the scale, though by afternoon they had dropped to moderate levels. The Beijing Environmental Bureau will start releasing PM2.5 measurements sometime before January 23, the Chinese New Year.
The Chinese government is implementing a plan to monitor PM2.5 across the nation by 2016. Even with improved monitoring, winter haze events may be difficult to control. One common cause of poor air quality in the winter is a temperature inversion in which a layer of cold, dense air gets trapped beneath a more buoyant layer of warm air. As long as the temperature inversion persists, pollution builds in the trapped pocket of air near the ground. Such inversions often contribute to poor winter air quality in the Beijing region.
Tuesday, January 17, 2012
Travelling
Sitting right now in Dallas/Ft Worth airport, waiting at gate C14 for my eventual flight to Detroit. Yesterday, I woke up in Valparaiso, Chile, and now I'm headed back to (apparently) rainy Ann Arbor.
Monday, January 16, 2012
The world will END in 2012 (or at least a calendar will end)
No doubt that many people in the world (at least in the West) are going to get hyped up over the end of the world that is - according to some people - going to happen in 2012. Already there was the blockbuster (and hilariously crazy) 2012, and there is the film The Darkest Hour (which is also another end-of-the-world story). Way back in 2004, there was The Day after Tomorrow (a climate-change-will-end-the-world story), but that wasn't so much tied into the 2012 fanaticism that has more recently come about.
The Mayans seem to be taking most of the brunt of this frenzy, with many people pointing to them as prophesying the end of the world in 2012. However, what is this based on? Apparently it's a bunch of half-truths and poor understandings that are rooted in (what appears to me) a rock-hard belief in the power of numbers and that great social construction (originally meant to predict celestial events): the calendar.
So what, then, should we know about the Mayan long count calendar that makes 2012 so worrisome (or not so worrisome)? Well, (if we can trust Wikipedia as a source on the facts about what the calendar is):
... about as much as it does when you took down your 2011 calendar and put up your 2012 calendar. (Or, if you are like me, you realized that you still had a 2008 wall calendar and you replaced that one with a new 2012 calendar.) Or, if you believe in the writings of the Popol Vuh, this date holds some level of significance (but only in that it is the start of the 14th b'ak'tun in 2012, and it took as many b'ak'tuns for the gods to get it right in the first case):
After all, there isn't any actual written prophesy that the Mayan gods will wipe away what took them 14 b'ak'tuns to create in the first place, just that it took them 14 b'ak'tuns to get to man, and that we are approaching the 14th since then.
... so enjoy the year and all the movies that are likely to be released this year about the end of the world. Also, if you feel something that isn't quite right - an earthquake, a tornado, a late snowfall, an early snowfall, a hotter-than-usual summer, etc - then just remember that randomness exists in the universe, and also that we tend to exaggerate and remember events that our minds have been primed to think of as important.
ERRATA: The Mayan calendar's date for the creation of humanity is at odds with Bishop Ussher's calculation of Sunday (had to be a Sunday), October 23, 4004 BC (according to the proleptic Julian calendar). The fact that the two estimates are 890 years apart (give or take some months) probably won't make a difference to YACs who also are using the Mayan calendar to date the end of the world.
UPDATE (2012-02-16): C.G.P. Grey made a video on this topic:
The Mayans seem to be taking most of the brunt of this frenzy, with many people pointing to them as prophesying the end of the world in 2012. However, what is this based on? Apparently it's a bunch of half-truths and poor understandings that are rooted in (what appears to me) a rock-hard belief in the power of numbers and that great social construction (originally meant to predict celestial events): the calendar.
So what, then, should we know about the Mayan long count calendar that makes 2012 so worrisome (or not so worrisome)? Well, (if we can trust Wikipedia as a source on the facts about what the calendar is):
The Mesoamerican Long Count calendar is a non-repeating, vigesimal (base-20) and base-18 calendar used by several Pre-Columbian Mesoamerican cultures, most notably the Maya. For this reason, it is sometimes known as the Maya (or Mayan) Long Count calendar. Using a modified vigesimal tally, the Long Count calendar identifies a day by counting the number of days passed since a mythical creation date that corresponds to August 11, 3114 BCE in the Gregorian calendar.[n 1] The Long Count calendar was widely used on monuments.Okay, so what, though? Well, a b'ak'tun is equivalent to 144,000 days, roughly 394.3 solar years, and (according to the Mayans) it took 13 b'ak'tuns to create the world (way back on August 11, 3114 BCE), and thus started the beginning of the current human period. December 20, 2012 is the completion of 13 b'ak'tuns since the beginning of the current period, which means...
The Long Count calendar identifies a date by counting the number of days from a starting date that is generally calculated to be August 11, 3114 BCE in the proleptic Gregorian calendar or September 6 in the Julian calendar (or −3113 in astronomical year numbering). There has been much debate over the precise correlation between the Western calendars and the Long Count calendars. The August 11 date is based on the GMT correlation (see Correlations between Western calendars and the Long Count calendar section elsewhere in this article for details on correlations).
The completion of 13 b'ak'tuns (August 11, 3114 BCE) marks the Creation of the world of human beings according to the Maya. On this day, Raised-up-Sky-Lord caused three stones to be set by associated gods at Lying-Down-Sky, First-Three-Stone-Place. Because the sky still lay on the primordial sea, it was black. The setting of the three stones centered the cosmos which allowed the sky to be raised, revealing the sun.[1]
Rather than using a base-10 scheme, like Western numbering, the Long Count days were tallied in a base-20 and base-18 scheme. Thus 0.0.0.1.5 is equal to 25, and 0.0.0.2.0 is equal to 40. The Long Count is not consistently base-20, however, since the second digit from the right rolls over to zero when it reaches 18. Thus 0.0.1.0.0 does not represent 400 days, but rather only 360 days.
... about as much as it does when you took down your 2011 calendar and put up your 2012 calendar. (Or, if you are like me, you realized that you still had a 2008 wall calendar and you replaced that one with a new 2012 calendar.) Or, if you believe in the writings of the Popol Vuh, this date holds some level of significance (but only in that it is the start of the 14th b'ak'tun in 2012, and it took as many b'ak'tuns for the gods to get it right in the first case):
According to the Popol Vuh, a book compiling details of creation accounts known to the K'iche' Maya of the Colonial-era highlands, we are living in the fourth world.[33] The Popol Vuh describes the first three creations that the gods failed in making and the creation of the successful fourth world where men were placed. In the Maya Long Count, the previous creation ended at the start of a 14th b'ak'tun.Of course, all this requires that you also believe that the Mayan gods (or the gods that the Mayans came to worship) are somehow going to come back and re-make the world at the end of 2012. If you believe in another set of gods, believing that the end of the world will occur on December 20, 2012 seems to me to make you at least somewhat accepting of gods that don't belong in your theism. (Whether this is equivalent to apostasy is up to you or your religion, though.) If you don't believe in any set of gods, then this is just a bunch of bunkum. And if you do believe in the Mayan gods, then this is problematic... or is it?
After all, there isn't any actual written prophesy that the Mayan gods will wipe away what took them 14 b'ak'tuns to create in the first place, just that it took them 14 b'ak'tuns to get to man, and that we are approaching the 14th since then.
... so enjoy the year and all the movies that are likely to be released this year about the end of the world. Also, if you feel something that isn't quite right - an earthquake, a tornado, a late snowfall, an early snowfall, a hotter-than-usual summer, etc - then just remember that randomness exists in the universe, and also that we tend to exaggerate and remember events that our minds have been primed to think of as important.
ERRATA: The Mayan calendar's date for the creation of humanity is at odds with Bishop Ussher's calculation of Sunday (had to be a Sunday), October 23, 4004 BC (according to the proleptic Julian calendar). The fact that the two estimates are 890 years apart (give or take some months) probably won't make a difference to YACs who also are using the Mayan calendar to date the end of the world.
UPDATE (2012-02-16): C.G.P. Grey made a video on this topic:
Sunday, January 15, 2012
Vehicular fuel consumption: it's significantly affected by friction losses
I didn't know this, but apparently up to 1/3 of vehicular fuel consumption is wasted on friction. Yep, based on estimates of European drivers in a story over at PhysOrg:
Of course, drivers can drive slower, and thus reduce fuel consumption even further than what is proposed through friction-reduction technology alone:
The killer line (at least for the greenie in me) is actually toward the beginning of the article:
But I don't own a car, and I don't drive very often, so what do I care? Well, friction is also an important thing to consider when riding a bike and purchasing components. I've been lucky to be able to afford good components that allow for really low friction at the pedal and the wheel, and I (usually) keep my chain well-oiled to ensure that I don't lose too much power in overcoming the friction there.
There are 612 million cars in the world today. The average car clocks up about 13,000 km per year, and in the meantime burns 340 litres of fuel just to overcome friction, costing the driver EUR 510 per year.What's more, here's the tally for where all the fuel is being consumed in an average internal combustion engine (ICE) setting:
- 33%: exhaust
- 29%: cooling
- 38%: mechanical energy (33% friction + 5% air resistance)
Woah. To put that in terms in context:
Annual friction loss in an average car worldwide amounts to 11,860 MJ: of this, 35% is spent in overcoming rolling resistance in the wheels, 35% in the engine itself, 15% in the gearbox and 15% in braking. With current technology, only 21.5% of the energy output of the fuel is used to actually move the car; the rest is wasted.What? Out of the $4/gallon that people are spending to fill up their cars, they are squandering $3/gallon to just get their ICE car to a point where it is capable of movement? But technology is (potentially) on the way to help!
Friction can be reduced by 10% to 50% using new surface technologies such as diamond-like carbon materials and nanocomposites. Laser texturing can be employed to etch a microtopography on the surface of the material to guide the lubricant flow and internal pressures so as to reduce friction by 25% to 50% and fuel consumption by 4%. Ionic liquids are made up of electrically charged molecules that repel one another, enabling a further 25% to 50% reduction in friction.Well, so... improvements in friction reduction can help reduce fuel consumption by 4% through laser texturing and an additional 4% through using ionic liquids. So technology helps with reducing fuel consumption by up to 8%!
Of course, drivers can drive slower, and thus reduce fuel consumption even further than what is proposed through friction-reduction technology alone:
A reduction of 10% in driving speed, e.g. from 110 km/h to 100 km/h, translates into a 16% saving in fuel consumption.And that's dropping from 68mph to 62mph, which is far below most states' highway speed limits. Dropping one's speed from 80mph to 55mph (what many people drive at on MI highways vs. the speed at which cars are rated for their fuel economy) will translate into a 28% saving in fuel consumption.
The killer line (at least for the greenie in me) is actually toward the beginning of the article:
By comparison, an electric car has only half the friction loss of that of a car with a conventional internal combustion engine.Why? Because an electric car doesn't have all those moving parts in its engine that an ICE has. Every moving part creates friction losses, which add up. In addition, the vibrations of the engine itself creates friction losses. Furthermore, every moving part in an ICE has the potential of having crud build up in it, thus diminishing its smooth running. In comparison, an electric engine has ... no moving parts.
But I don't own a car, and I don't drive very often, so what do I care? Well, friction is also an important thing to consider when riding a bike and purchasing components. I've been lucky to be able to afford good components that allow for really low friction at the pedal and the wheel, and I (usually) keep my chain well-oiled to ensure that I don't lose too much power in overcoming the friction there.
Saturday, January 14, 2012
Indian government agrees to pursue Google and Facebook censorship
To continue with a theme that started in December - India to ban "offensive material" from the Internet - PhysOrg presents the next stage of the farce that now seems evermore likely to happen: India is going to try to censor offensive material from the Internet:
Or you can do the sane thing and recognize that if people are stupid and want to say stupid things then let them be stupid and don't listen to them. Teach your followers to learn how to recognize the stupid people and the stupid things that they say. You know: indoctrinate them.
India's government authorised on Friday the prosecution of 21 Internet firms including Facebook and Google in a case over obscene content posted online, two sources told AFP.Why do I have to change in order to maintain religious harmony in India? How is it the fault of Facebook if someone in another country decides to post something that someone in India finds religiously offensive? Similarly, how is it the fault of Google if their search engine finds something that someone in India finds religiously offensive?
The approval could lead to company directors being called to a trial court in New Delhi to answer serious charges such as fomenting religious hatred and spreading social discord, an official and a lawyer said.
A criminal case against the companies was first brought by journalist Vinay Rai who complained that the websites were responsible for obscene and offensive material posted by users.
He also complained that they had broken laws designed to maintain religious harmony in India, a more serious offensive that requires government approval to be admitted in court.
Or you can do the sane thing and recognize that if people are stupid and want to say stupid things then let them be stupid and don't listen to them. Teach your followers to learn how to recognize the stupid people and the stupid things that they say. You know: indoctrinate them.
Friday, January 13, 2012
Global study shows: a sedentary lifestyle is correlated with higher incidence of heart disease
As if it weren't too terribly obvious from that much-maligned common sense, a new global study of 29,000 people from 52 countries in Asia, Europe, North America, South America, Australia and the Middle East has shown:
To me, it makes sense that doing more physical activity than effectively nil produces a more physically healthy body. Removing options for that will lead to costs that will need to be paid down the road (unless you happen to have good genetics or are really lucky). To that end, I'm kind of glad that I decided to purchase a good, study bike instead of a reliable used car; my 8-10 mile daily commute on that personal pedal-powered vehicle has helped me lose a decent amount of weight, lowered my resting heart rate, and likely helped in other ways that are less apparent.
(And when I was 10 years old, the idea of a personal robot that would do everything for me was soooo appealing. I suppose that if I did ever get a personal robot, it would have to also act as a physical fitness trainer; forcing me to do physical labor so that its help with alleviating my physical labors wouldn't be offset by the negative outcomes of a sedentary lifestyle that a personal robot would be designed to create.)
mild to moderate physical activity at work, and any level of physical activity during leisure time reduces the risk of heart attack, independent of other traditional risk factors in men and women of all ages, in most regions of the world and in countries with low, middle or high income levels. Interestingly, heavy physical labour at work did not protect against heart attacks.... Furthermore, ownership of a car and TV, which promotes sedentary behaviour, was found to be independently associated with the risk of heart attacks.And the authors were able to run the numbers of how much help light and moderate physical activity helps with reductions in heart attacks:
...they found that people whose work involved either light or moderate physical activity had a fifth (22%) or a tenth (11%) lower risk of having a heart attack when compared to people whose occupation was mainly sedentary. However, heavy physical labour did not reduce the risk at all. During leisure time, the risk of a heart attack was lower for any level of exercise when compared with being mainly sedentary, reducing by 13% for mild activity and 24% for moderate or strenuous activity.Of course, physical exercise isn't the only thing that these people looked at. After all, it would be a waste of an opportunity to look at a panel of conditions for so many people. And some of the additional things that they asked questions about - in order to control for confounding in the population:
After adjusting for various confounding factors such as age, sex, country, income, smoking, alcohol, education, health, diet etc...... and they found that:
People who owned both a car and a TV, both indicators of a sedentary lifestyle, had a 27% increased risk of a heart attack, compared to those who owned neither a car nor a TV.So what is the take-home from this study?
The authors conclude that daily moderate physical exercise should be encouraged in everyone to prevent heart disease. Prof Held added: "The data have some real-life implications. One suggestion may be for the lower income countries to be more involved in promoting physical activity as their societies starts to use more labour-saving devices, so as to counter-act the inactivity that this can lead to; however, it also important to promote physical activity in all parts of the world."To me, the basic lesson is a good one. However, I think that Prof Held seems to forget one of the greatest "labour-saving devices" that tends to get implemented once income levels rise: motorized personal vehicles (mopeds, motorcycles, cars, trucks). In so many places that have undergone "development", there has been a concomitant increase in personal motor vehicle use, a shift away from public transportation options (such as buses, bus-taxis, etc), which increases road congestion and increases public health problems caused by exhaust inhalation (exacerbated due to lax/nonexistent car exhaust laws/enforcement of such laws). Furthermore, increased personal motor vehicle use is also coupled with increased road fatalities and serious injury than predominantly public transport, bike, and walking transportation options. Furthermore, in the authors' study, easy walking was listed as "light exercise" (something that drastically diminishes with car and TV ownership) and walking and cycling were listed as "moderate exercise" (something that also drastically diminishes with car and TV ownership).
To me, it makes sense that doing more physical activity than effectively nil produces a more physically healthy body. Removing options for that will lead to costs that will need to be paid down the road (unless you happen to have good genetics or are really lucky). To that end, I'm kind of glad that I decided to purchase a good, study bike instead of a reliable used car; my 8-10 mile daily commute on that personal pedal-powered vehicle has helped me lose a decent amount of weight, lowered my resting heart rate, and likely helped in other ways that are less apparent.
(And when I was 10 years old, the idea of a personal robot that would do everything for me was soooo appealing. I suppose that if I did ever get a personal robot, it would have to also act as a physical fitness trainer; forcing me to do physical labor so that its help with alleviating my physical labors wouldn't be offset by the negative outcomes of a sedentary lifestyle that a personal robot would be designed to create.)
Thursday, January 12, 2012
Photo each day... for 13 years
No... as much as I like to take photos, this one's not about me, but about Jeff Harris's project (starting in 1999) to take a photo of himself each day.
Jeff Harris: 4,748 Self-Portraits and Counting from We Know Music on Vimeo.
From Time:
All I can say is, really quite cool... And I thought that my little project of taking a photo of the same view out of the front of the cabin was a bit of heavy going. Having to take a new photo of yourself each day? That's awesome!
Jeff Harris: 4,748 Self-Portraits and Counting from We Know Music on Vimeo.
From Time:
In an effort to record the year of his life leading up to the millennium, Jeff Harris began a project in which he used his trusty Olympic Stylus 35mm film camera (he’s since gone through six) to take a self-portrait each day and then posted the results on his website. The project, which began long before the widespread popularity of blogging, Facebook and Flickr, allowed viewers to follow one photographer along on his adventures. “I didn’t want 365 images of me sitting on the couch each day,” says Harris. “There could have been that tendency, especially during the cold dark winter months to stay inside all the time, but this project inspired me to get out there and seek out interesting things.” This year, Harris embarks on year fourteen of what has turned out to be an epic, inspired and ever-evolving art project that documents a life well lived.Jeff's project has been discussed in Autofocus.
The images range from completely solitary, auto-timed self-portraits to photographs inspired by a collaborative spirit with whomever Harris encounters on a given day. Regardless of the mood, location or activity at the center of any given image in the series, they all show a marvelously open and generous approach to both diaristically recording and sharing everything from intimate moments to athletic adventures with a wider audience. In fact, Harris evokes the full range of physical experiences a body can encounter: from mundane inactivity to joyful dives to his body being open on the operating table.
All I can say is, really quite cool... And I thought that my little project of taking a photo of the same view out of the front of the cabin was a bit of heavy going. Having to take a new photo of yourself each day? That's awesome!
Painting 3D goldfish
Via TreeHugger
The hyper-real gold fish by Ryusuke Fukahori aren't actually real... They are painted in layers on acrylic, coming to artificial life with the clear acrylic. Kind of mesmerizing...
For more information (in Japanese) go to: http://goldfishing.info/
Wednesday, January 11, 2012
Re-using water
If you ever learned anything about water in the natural world, you've probably learned about the water cycle. You know, water evaporates from the oceans (or lakes, or rivers, or anywhere, really, but it's usually depicted as the oceans, since this is where most evaporation occurs in the world), condensates to form clouds, and then precipitates (either as rain or snow) to fall upon the land, where it is either intercepted by plants or finds its way to the ground, and then into rivers or the groundwater, to eventually flow back (ultimately) to the oceans. True, there are parts of this that are complicated by the presence of other things that use the water - like animals drinking it and excreting it as sweat or waste - but the water that ends up in the oceans is the water that started in the ocean, and so it continues...
But let's focus on that little interruption: the "like animals drinking it and exreting it" part. We humans do a great job of collecting, concentrating, and treating (to a degree) water we use for drinking. We humans also do a great job of collecting, concentrating, and treating (to a degree) water we have urinated or defecated into. Such treated waste water invariably ends up in a water body, and if we are not next to the ocean, that waterbody tends to be the nearest one around (usually a river or a lake), and after a stretch of several tens of miles, there is a place where water is withdrawn (usually from a river or a lake, but also often from groundwater) for use as drinking water without people having an *ick* reaction.
If you were one of the people who remembers the bru-ha-ha that happened in June 2011, when Portland emptied an 8-million gallon reservoir after a man urinated in it, then you will likely think that what more scientists and planners propose in the future is going to be gawdawful: reuse municipal wastewater to augment drinking water supplies. If you're gagging in your coffee right now, then let me first say a few things about the Portland incident:
- the human bladder can contain between 200-800 mL of urine (0.05-0.21 gallon).
- rounding 0.25 gallon of urine (let's assume the Portland guy had a really big bladder that was completely full), the concentration of urine was 0.25 gallons urine/7800000 water = 0.000000032 gallons urine/gallon water (and that's assuming that the water in the reservoir was pure water, and the urine was pure urine).
They are basically implying that the reservoirs are full of Evian when they are full of water that's going to be treated anyway. They claimed that people in the area "may" have thrown objects in the water, but those people were questioned. Seems like they were more interested in finding an excuse to drain the water.And water recycling (if done correctly) is not gross. It is - after all - what astronauts have done for a long time, and what the city of Singapore has been doing for over a decade now. Further (to use points from the post at PhysOrg):
The pity is that people are NOW going to think their reservoirs are super clean (not!) and that water recycling is way too gross (not!).
Potable water reuse projects account for only a small fraction of the volume of water currently being reused. However, many drinking water treatment plants draw water from a source that contains wastewater discharged by a community located upstream; this practice is not officially acknowledged as potable reuse.If you are still gagging a little to think about these sorts of things, then the next point might not give you too much peace of mind about the current state of affairs with regard to governance:
The concentrations of chemicals and microbial contaminants in reuse projects designed to augment drinking water supplies can be comparable to or lower than those commonly present in many drinking water supplies.
Water reuse projects tend to be more expensive than most water conservation options and less expensive than seawater desalination and other new supply alternatives. Although the costs of reclaimed water are often higher than current water sources, the report urges water authorities to consider other costs and benefits in addition to monetary expenditures when assessing reuse projects. For example, water reuse systems used in conjunction with a water conservation program could be effective in reducing seasonal peak demands on the drinking water system. Depending on the specific designs and pumping requirements, reuse projects could also have a larger or smaller carbon footprint than existing supply alternatives or reduce water flows to downstream users and ecosystems.
Water reuse regulations differ by state and are not based on risk-assessment methods, the report says. Adjustments to the federal regulatory framework could help ensure a high level of public health protection, provide a consistent minimum level of protection across the nation, and increase public confidence in potable and non-potable water reuse.
Tuesday, January 10, 2012
Passively losing weight: two methods
In my news feeds (Facebook and Google Reader) come two stories that point out some ways that you could passively lose some weight (i.e., lose weight without exercising). Now, whether this is good for you is a different question, but let me list them and then discuss them briefly:
The second comes from fitbie.MSN. It estimates that roughly 100 - 200 calories per day can be burned by keeping the temperature in one's home at about 60F. This is because the body will convert fat into "brown fat" (which it uses for heat generation) and not as "white fat" (which it uses for energy storage). (Fitbie in fact has 14 other "lazy tips" to lose weight, but the temperature one was what showed up on my FB newsfeed.)
So what's so important with diminishing 225-500 calories each day? I mean, one venti Caramel Brulee Frappuccino with whole milk from Starbucks is 520 calories (even making it a tall with skim milk and no whipped cream still makes it 210 calories), which busts through the high end (and almost kills the low end) of the passive weight loss figure. Of course, that's not the point of such a tally. The main thing is to recognize that calorie intake is one of the most important indicators of (most people's) weight change (the other is metabolism), and burning up to an extra 500 calories per day really can add up over weeks and months. For example, for the average 35-year-old female (5'4", 164 lbs) 500 calories means not eating a day's worth of calories every 3.4 days, and for the average 35-year-old male (5'9", 191lbs) is equivalent to not eating a day's worth of calories every 3.9 days (based on maintenance intake, as calculated here). A loss of 500 calories each day means that both the average female and average male would be in the "fast weight loss" zone, which is equivalent to up to 1-2 pounds per week, and that's significant.
So there you have it: through a combination of staying a bit chilly (and 60F ain't that bad, really) and making better food choices, a person can (through calorie burning and missed intake) diminish their daily calorie count by up to 500 calories each day, which could - could being the operative word here - result in significant weight loss results... all without doing any additional exercise.
- Make better decisions when eating out.
- Keep the temperature at 60F.
The second comes from fitbie.MSN. It estimates that roughly 100 - 200 calories per day can be burned by keeping the temperature in one's home at about 60F. This is because the body will convert fat into "brown fat" (which it uses for heat generation) and not as "white fat" (which it uses for energy storage). (Fitbie in fact has 14 other "lazy tips" to lose weight, but the temperature one was what showed up on my FB newsfeed.)
So what's so important with diminishing 225-500 calories each day? I mean, one venti Caramel Brulee Frappuccino with whole milk from Starbucks is 520 calories (even making it a tall with skim milk and no whipped cream still makes it 210 calories), which busts through the high end (and almost kills the low end) of the passive weight loss figure. Of course, that's not the point of such a tally. The main thing is to recognize that calorie intake is one of the most important indicators of (most people's) weight change (the other is metabolism), and burning up to an extra 500 calories per day really can add up over weeks and months. For example, for the average 35-year-old female (5'4", 164 lbs) 500 calories means not eating a day's worth of calories every 3.4 days, and for the average 35-year-old male (5'9", 191lbs) is equivalent to not eating a day's worth of calories every 3.9 days (based on maintenance intake, as calculated here). A loss of 500 calories each day means that both the average female and average male would be in the "fast weight loss" zone, which is equivalent to up to 1-2 pounds per week, and that's significant.
So there you have it: through a combination of staying a bit chilly (and 60F ain't that bad, really) and making better food choices, a person can (through calorie burning and missed intake) diminish their daily calorie count by up to 500 calories each day, which could - could being the operative word here - result in significant weight loss results... all without doing any additional exercise.
Subscribe to:
Posts (Atom)