Methodology
Using the Gallup data split by education for Non-Hispanic Whites, I inputted the figures for Obama and McCain supporters. After doing this, I subtracted the McCain polling percentage from the Obama polling percentage. This was also done for the polling data from the General Population. The resulting difference from each set of polls was then graphed. Due to the equation I used (Obama - McCain), values in the positive range indicate support for Obama by members of the group in question, while values in the negative rage indicate support for McCain by members of that group.
After producing these two graphs, I then subtracted the Non-Hispanic Whites set valuse from the General Population set values individually for both Obama and McCain. These differences were then graphed on a final graph. Again, due to the equation I used (General Population - Non-Hispanic Whites), values in the positive range indicate support for Obama, while those in the negative range indicate support for McCain.
(Please note: I do understand that adding and subtracting percentages is problematic. I also do understand that adding and subtracting when the total doesn't add up to 100% is a problem. However, this is kind of fast-and-dirty, and only done to see if there are larger trends.)
Results
First, let's look at the group Non-Hispanic Whites, split by eduction:
It appears that those polled with postgraduate educations consistently supported Obama over McCain. On the other hand, for much of the polling period (8/12/2008 - 9/24/2008), McCain had a commanding lead over Obama amongst all other education groups of Non-Hispanic Whites. However, after the 9/24/2008 period, this support seems to be diminishing.
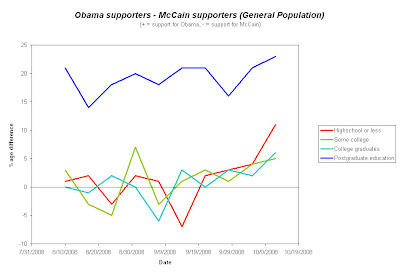
Next, let's look at the group General Population, split by education:
Similar to Non-Hispanic Whites, the general population of those polled with a postgraduate education consistently favored Obama. Of course, one might argue that the likelihood of a postgraduate-educated person being a "non-hispanic white" is quite high in this country, and so this trend will be driven by what one sees in the previous graph. However, one thing that is of interest is that in General Population, support among the other education groups for one candidate over another remains roughly even until 9/19/2008. After that point, the trend starts to move toward Obama among all the education groups, and seems to spike the highest among the group "Highschool or less" in the latest poll (10/12/2008).
Finally, let's look at the difference between General Population and Non-Hispanic White, split by education:
In this graph, it seems clear that there is a trend among Non-Hispanic Whites of all education groups to prefer John McCain, while the opposite trend - support for Barak Obama - seems to prevail amongst General Population (without the Non-Hispanic Whites). There are problems with this type of analysis, since I am trying to proxy race via two different sortings of the data. However, let's see what an analysis (Obama - McCain) of Race alone (Non-Hispanic Whites, Non-Hispanic Blacks, and Hispanics) says:
Here, "Non-Hispanic Blacks" overwhelmingly support Obama, while "Non-Hispanic Whites" only mildly support McCain over Obama. "Hispanics" tend to support Obama roughly 30% more than McCain. One could say from this that non-Hispanic whites are more ambivalent (as a group) than either Hispanics or non-Hispanic blacks, but still overall supporting McCain. However, the trend of support of late (since 9/29/2008) has been edging toward 0%.
I suppose that at the end of this week, we might be able to put another column of data on these graphs and see if the trends of the last two weeks will be carried forward. (Ahh, the greatness of the campaign comes in the fact that it offers many opportunities to fill one's time in procrastination, since the only poll that counts is the one cast in 15 day's time.)


No comments:
Post a Comment